Drift in machine learning comes in many shapes and forms, but the most frequently discussed is concept drift, a.k.a. posterior class shift. Concept drift is when the statistical relationship changes between the dependent variable Y (our target) and the explaining variable X (our features). Detecting any kind of drift in production is important. For example, input drift P(X) or label drift P(y) indicates that the training dataset did not accurately represent the production data. In this case, it’s likely that the trained model is sub-optimal. But, even here, the fundamental pattern or concepts connecting X and Y remains stable.
When it comes to concept drift, the actual pattern that defines the relationship between the input and the predicted output is what’s changing. Essentially, our model is no longer relevant to some degree and will make incorrect predictions.
More posts in this series:
- Everything you need to know about drift in machine learning
- Data drift detection basics
- Concept drift detection basics
- A hands-on introduction to drift metrics
- Common drift metrics
- Troubleshooting model drift
- Model-based techniques for drift monitoring
Why is concept drift so hard to detect?
It takes time – Based on the definition of concept drift, you would need examples of records that contain both the input X and output Y. For example, people’s behavior changed slowly over the course of the COVID lockdown. Collecting the information and detecting the change is not necessarily straightforward because the changes happened steadily over a long period–and it’s not always easy to identify a steady change when you also see new trends and fluctuations. This problem is made worse when Y values (the labels) can only be collected after a very long feedback delay that can last for days, weeks, or even months.
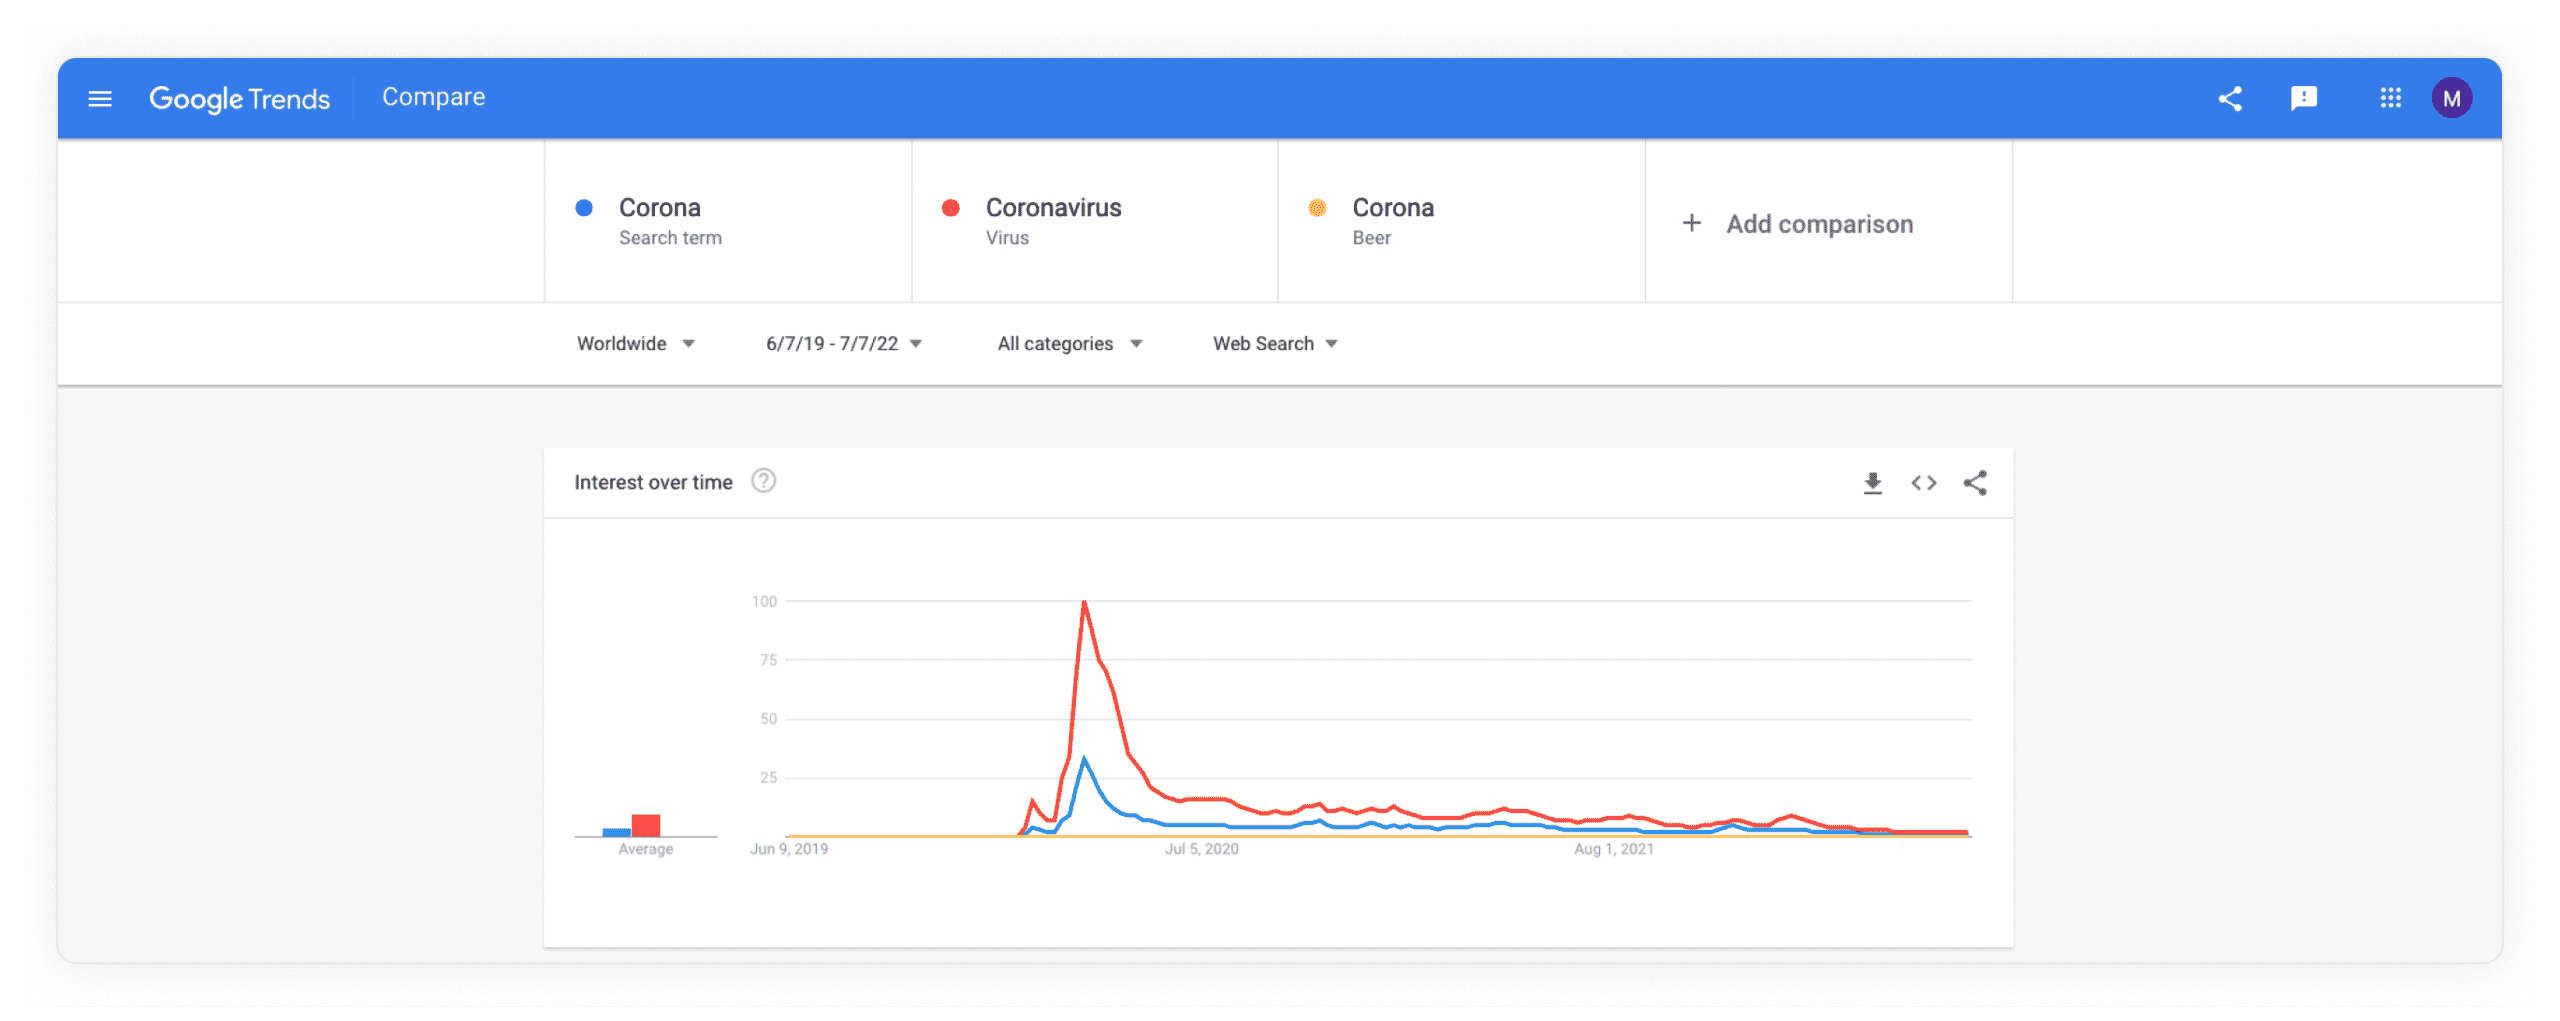
Conditional distribution change – Other types of drift can be spotted by noticing a statistical change in one specific univariate or multivariate distribution. With concept drift, we can’t look at only a single distribution. We have to examine the conditional distribution of Y given X. In an LTV use case, this could mean that while the “makeup” of site visitors remains the same as does their on-site behavior, new competitors in the market could lead to a different potential value for each visitor. Another example of concept drift would be a general-purpose search engine that leverages text classification methods to understand user queries and will need to know when trends or current events are influencing the meaning of different phrases. For example, after the COVID outbreak, the engine will need to give completely different answers to the question, “What is corona?”.

Approaches to concept drift detection
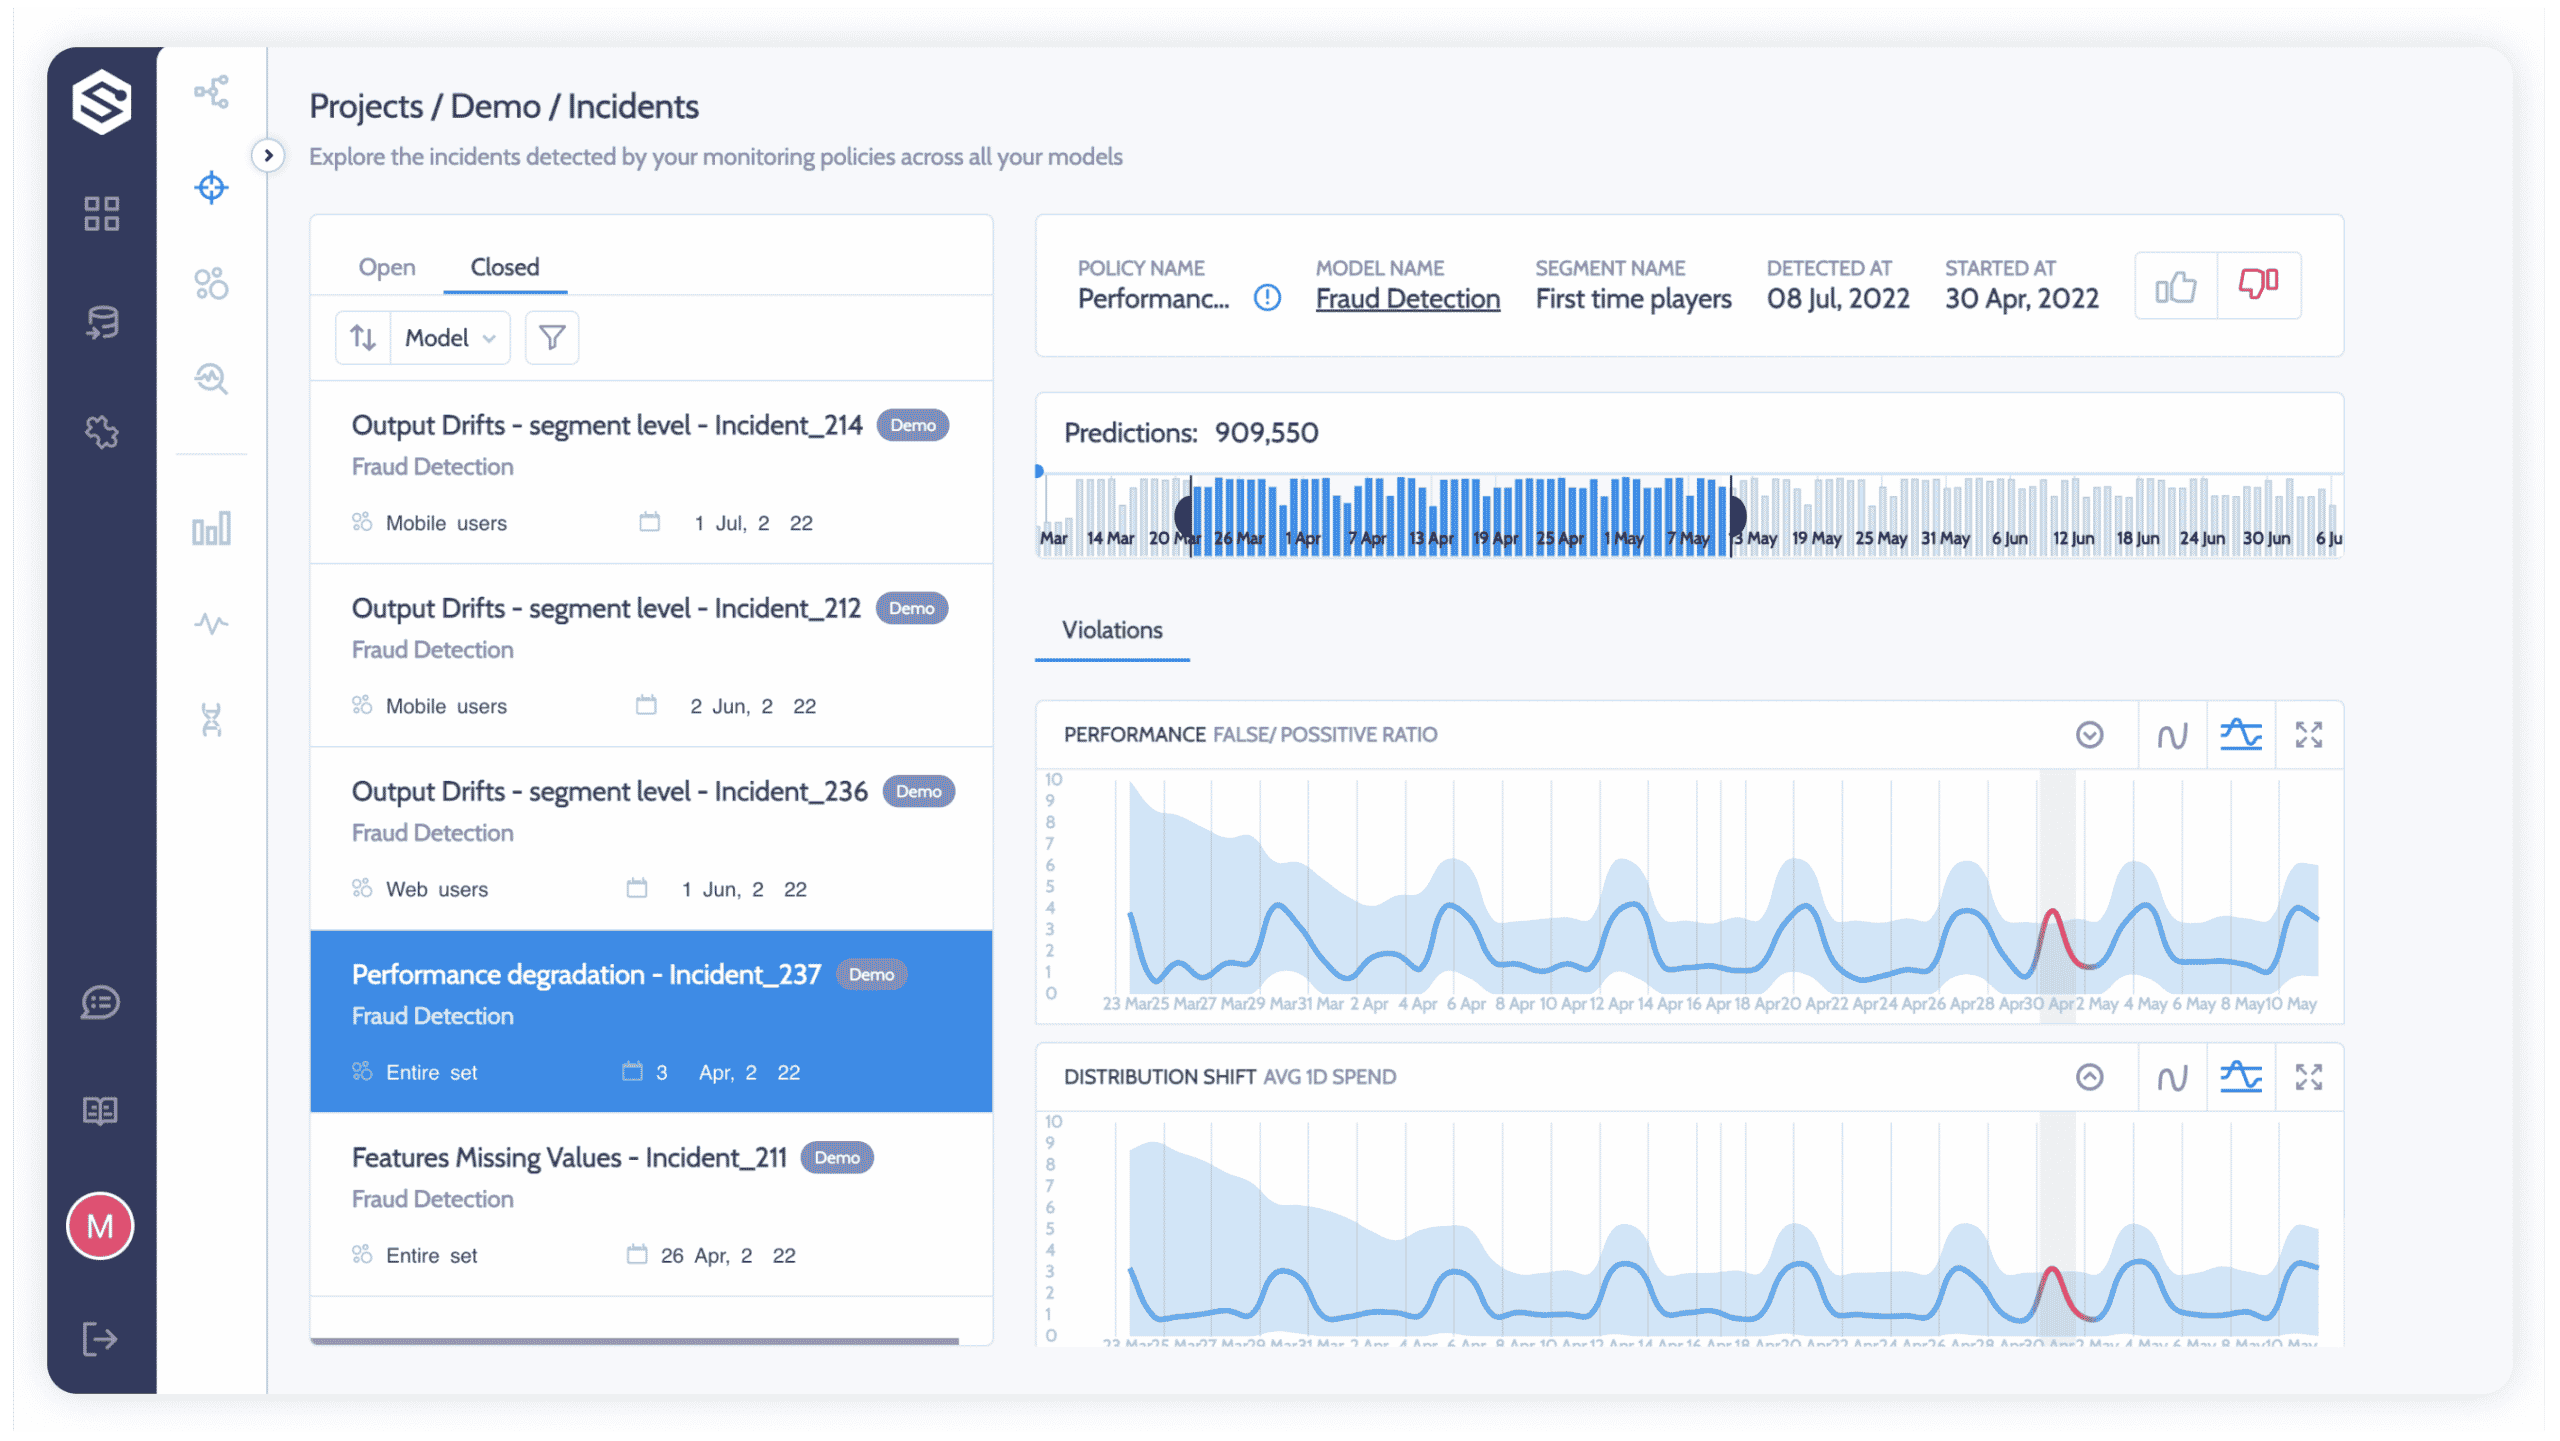
Performance degradation – Seeing your performance go downhill is the most naive and obvious approach to identifying concept drift. While all concept drifts will result in performance degradation, the ability to determine that the cause is concept drift depends on the availability and latency of actuals.
Disagreement of models – To examine whether new data contains a different pattern or concept than previous datasets, you can refit a new model using the most recent data. The new model should use the same algorithm and hyper-parameters as your previous model. This way, in the absence of concept drift, the new model should have the same or similar predictions to the one you have in production. If you see that predictions are not correlated between the models, that’s a good indication that the concepts have changed.
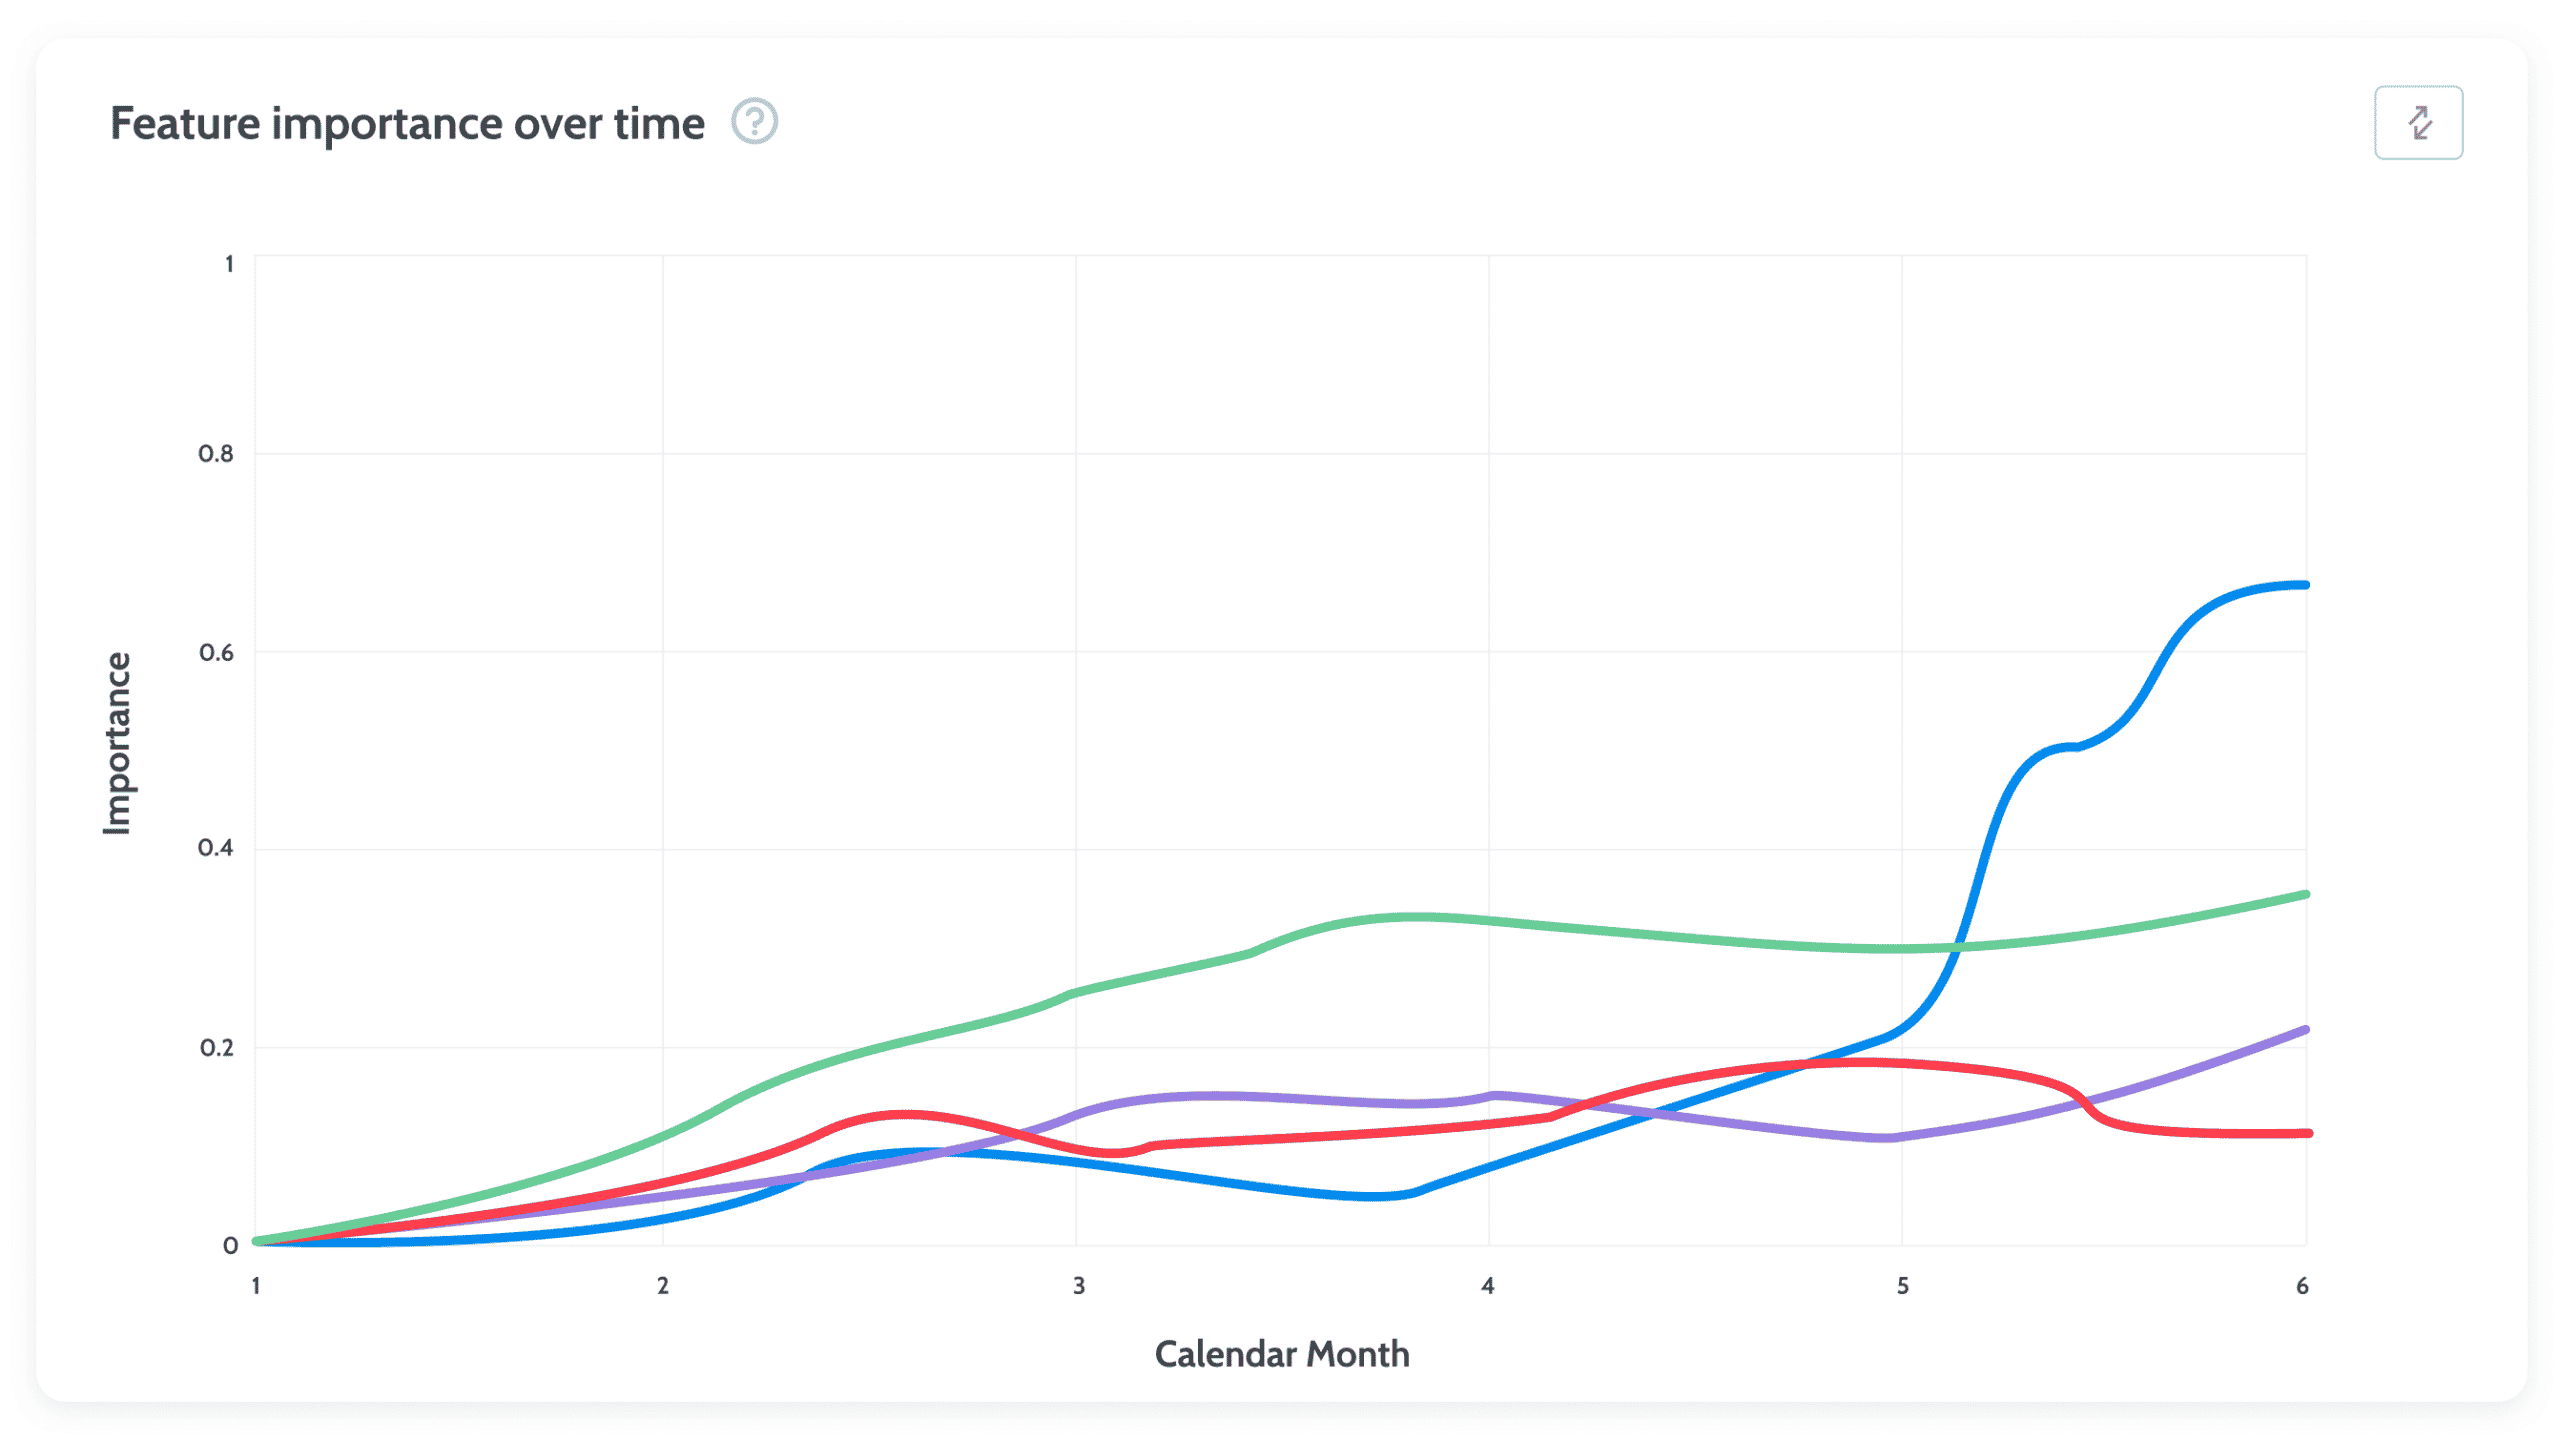
Change in feature importance – When there has been a change in how a feature affects the model’s performance, it may have an excessive or negligible influence on the predictions. Similar to the previous technique, you can build a new model and test it to see if the two models disagree. Alternatively, instead of waiting on new predictions, you can examine the influence of each feature on the model, given its training set. This kind of feature attribution can be calculated using out-of-the-box algorithms like XGBoost or random forest. Or, you can use a technique like SHAP to get a clearer picture of your model’s feature importance. If you see a drastic change in feature attribution between the two models, that’s a good indication of concept drift.

How to deal with concept drift
Because concept drift can make or break your application, it’s definitely worth setting up a model observability solution that can monitor and automatically detect these kinds of changes.
Defining drift metrics
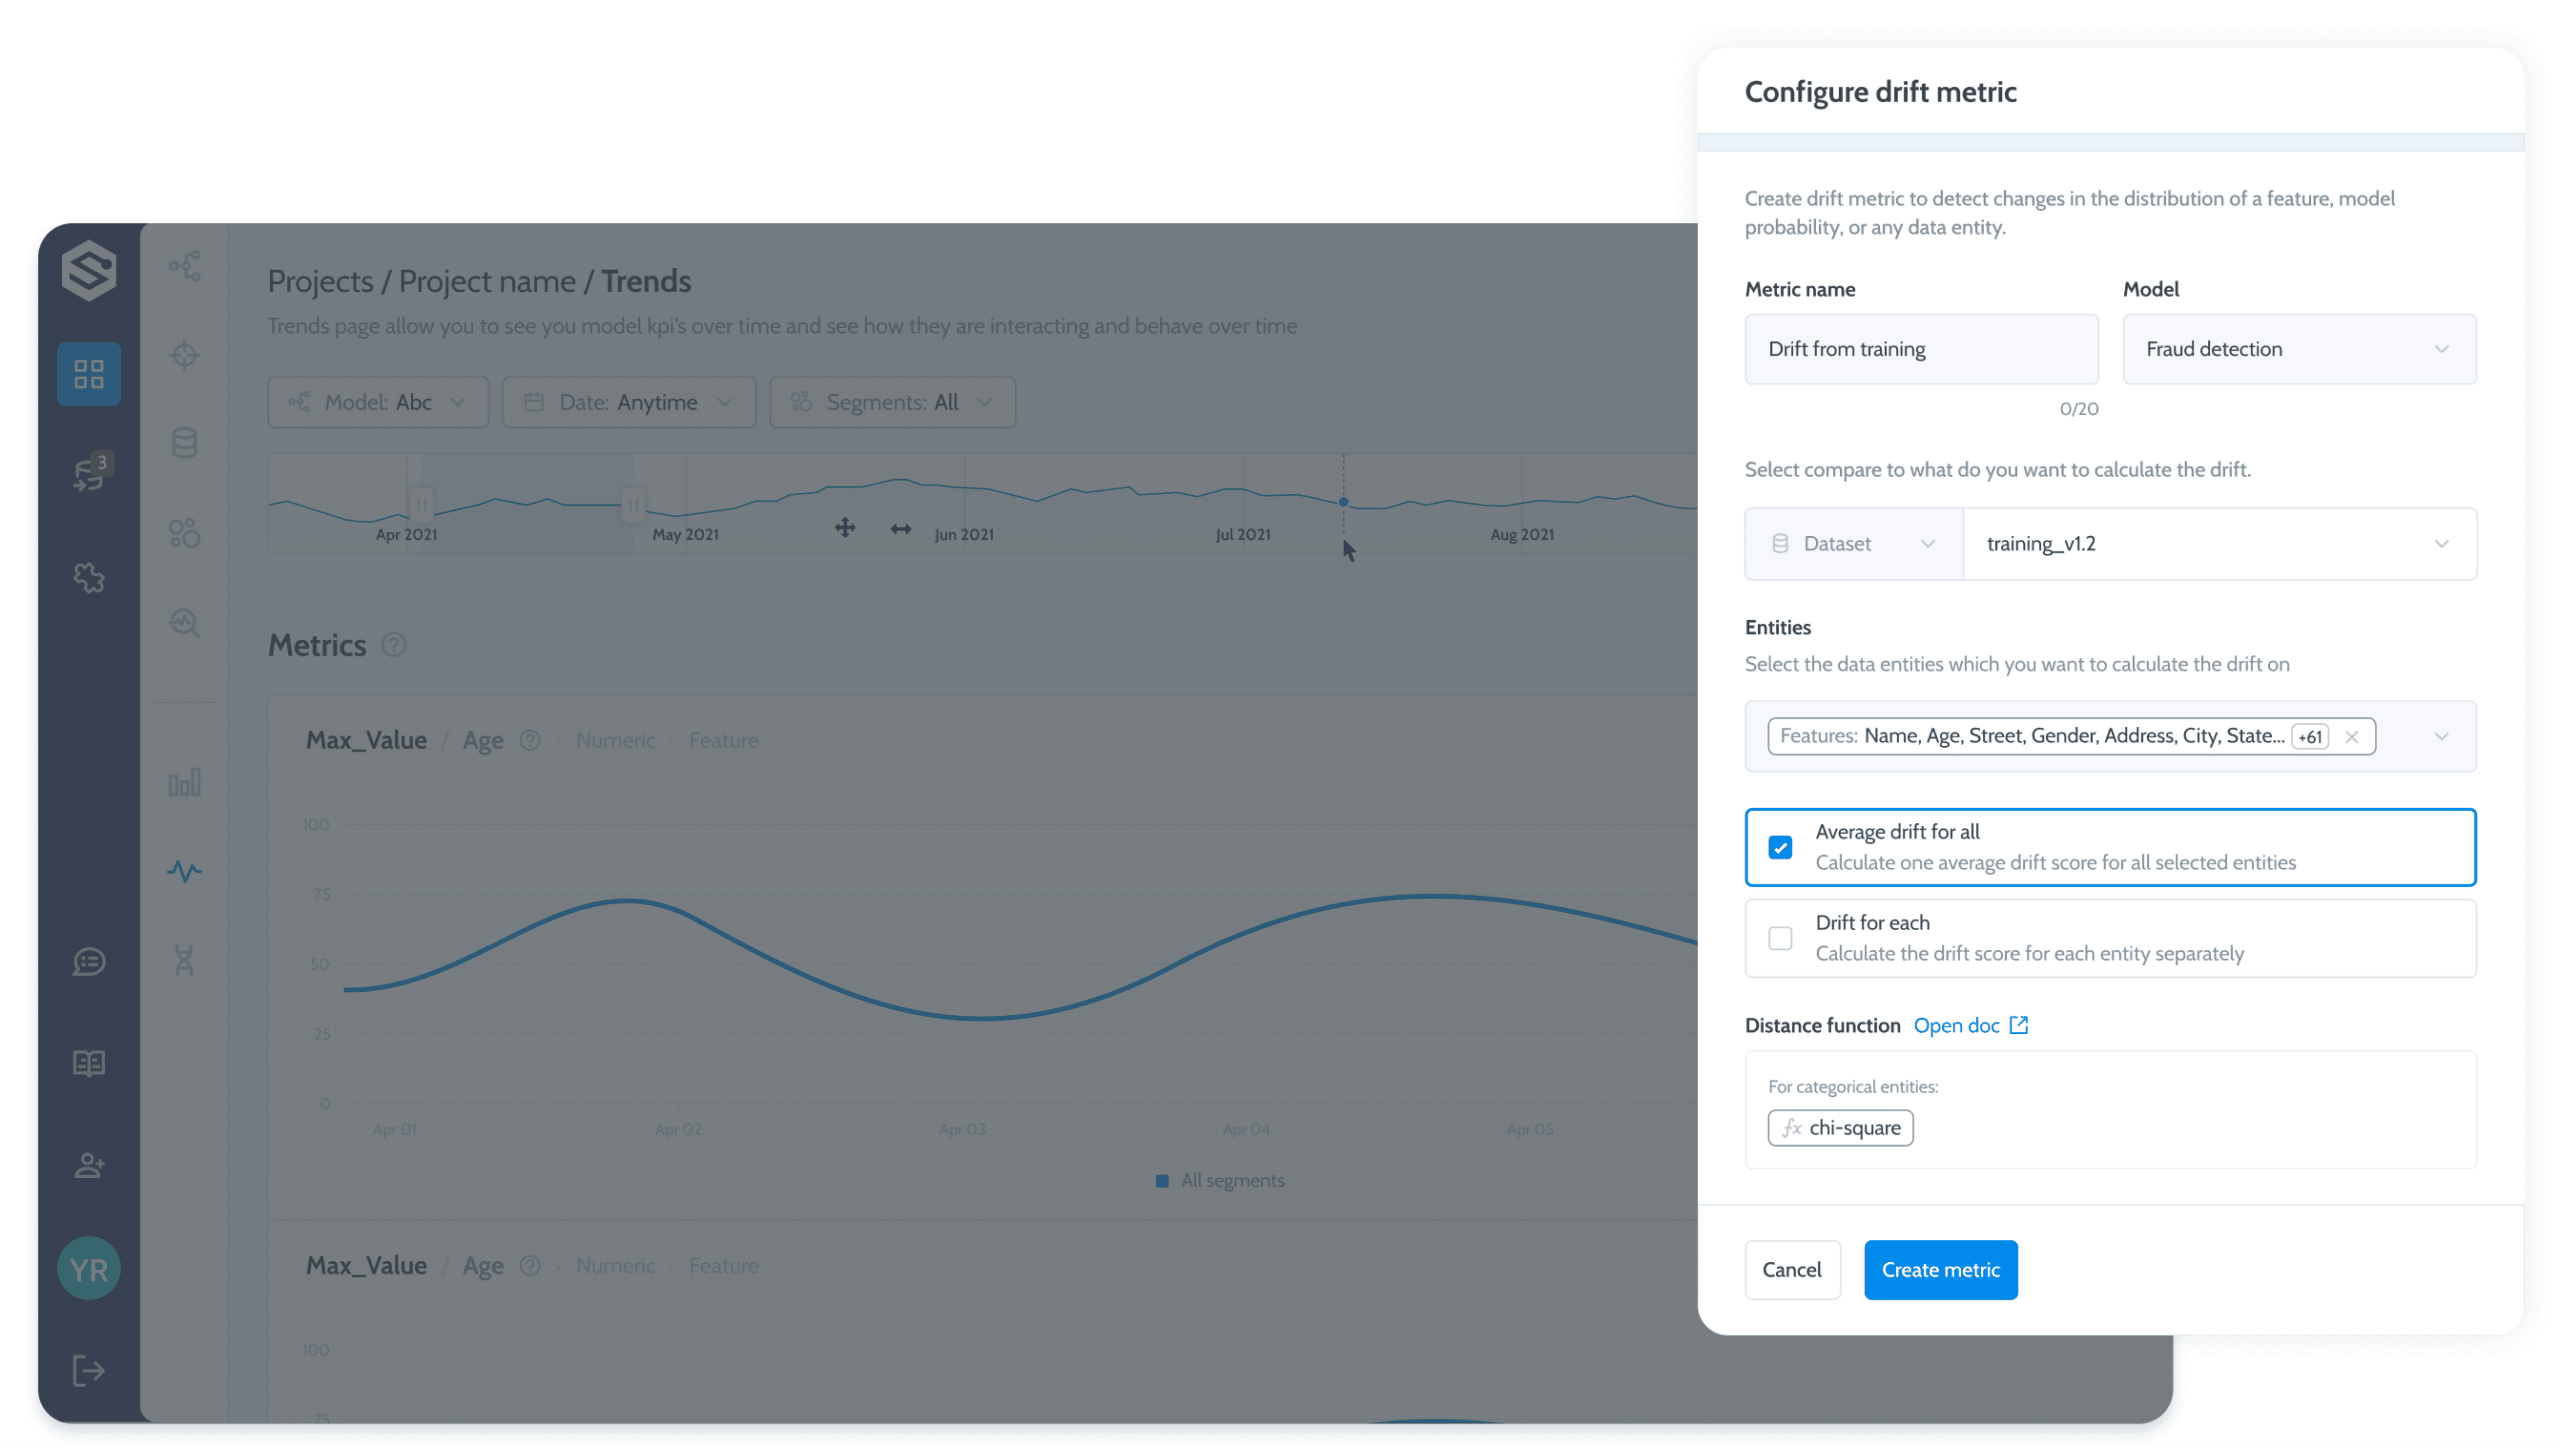
Defining drift is not a trivial decision to make. You need to understand what comparison periods and distance measurements are the most relevant to your use case. In many cases, daily period resolutions compared to your training dataset are sufficient, but in unbalanced scenarios such as fraud detection, you may decide to compare them to your test or validation dataset. Distance measurement functions also have pros and cons, and selecting the right drift metric/s for your use case is crucial.

Performance degradation policies
Content drift is all about context. What segments or subpopulations are affected? Are seasonal aspects taken into account? What thresholds or control limits are correct for the use case? What other features are drifting alongside your performance metric/s?

Triggering resolutions
With a monitoring solution in place, you can then automate the retraining process so your continuous training (CT) autonomously adjusts the model to new scenarios. The CT strategy should include the automatic triggering of when to retrain the model and what data should be used for this retraining. You can read more about building a successful CT strategy here and here.
Ready to get started with Superwise?
Head over to the Superwise platform and get started with easy, customizable, scalable, and secure model observability for free with our community edition. And yes, you can configure your own drift metrics!
Prefer a demo?
Pop in your information below, and our team will show what Superwise can do for your ML and business.
Everything you need to know about AI direct to your inbox
Superwise Newsletter
Superwise needs the contact information you provide to us to contact you about our products and services. You may unsubscribe from these communications at any time. For information on how to unsubscribe, as well as our privacy practices and commitment to protecting your privacy, please review our privacy policy.


