The real deal: model evaluation vs. model monitoring
Model evaluation and model monitoring are not the same thing. They may sound similar, but they are fundamentally different. Let’s see how.
Model evaluation and model monitoring are not the same thing. They may sound similar, but they are fundamentally different. Let’s see how.
Instead of focusing on theoretical concepts, this post will explore drift through a hands-on experiment of drift calculations and visualizations. The experiment will help you grasp how the different drift metrics quantify and understand the basic properties of these measures.
Drift in machine learning comes in many shapes and sizes. Although concept drift is the most widely discussed, data drift is the most frequent, also known as covariate shift. This post covers the basics of understanding, measuring, and monitoring data drift in ML systems.
Data drift occurs when the data your model is running on is different from that on which it was trained. Mathematically speaking, it means changes in the statistical distribution of the model inputs (i.e., P(X)). While this kind of change does not directly imply that the underlying pattern has changed (see our previous post on concept drift), it’s usually a good proxy indicator. Even if the patterns are stable, which means you don’t have concept drift on top of the data drift, your model is probably not optimal for its current environment, which has likely changed since the model was trained.
More posts in this series:
What do we mean by data drift? Say you have a bank that is using a binary classification model to predict the probability of a customer defaulting on a new loan request. Now, let’s say the bank’s marketing department launches a new, aggressive campaign to attract young students. Assuming the campaign is a success, it will lead to a different distribution in the type of customers asking for loans. Although the underlying reality of who is a good loan candidate and who isn’t has not changed, the bank’s classification model is no longer optimized for this new mix of user profiles.
As another example, let’s take a content publisher that has a machine learning model to classify sentiment analysis for readers’ feedback on news articles. If the publisher decides to try a different editorial policy that tends to create shorter articles, both the articles and the reader’s feedback will change. The original sentiment analysis model was not optimized for short articles and will start working differently once a greater portion of the articles are short.
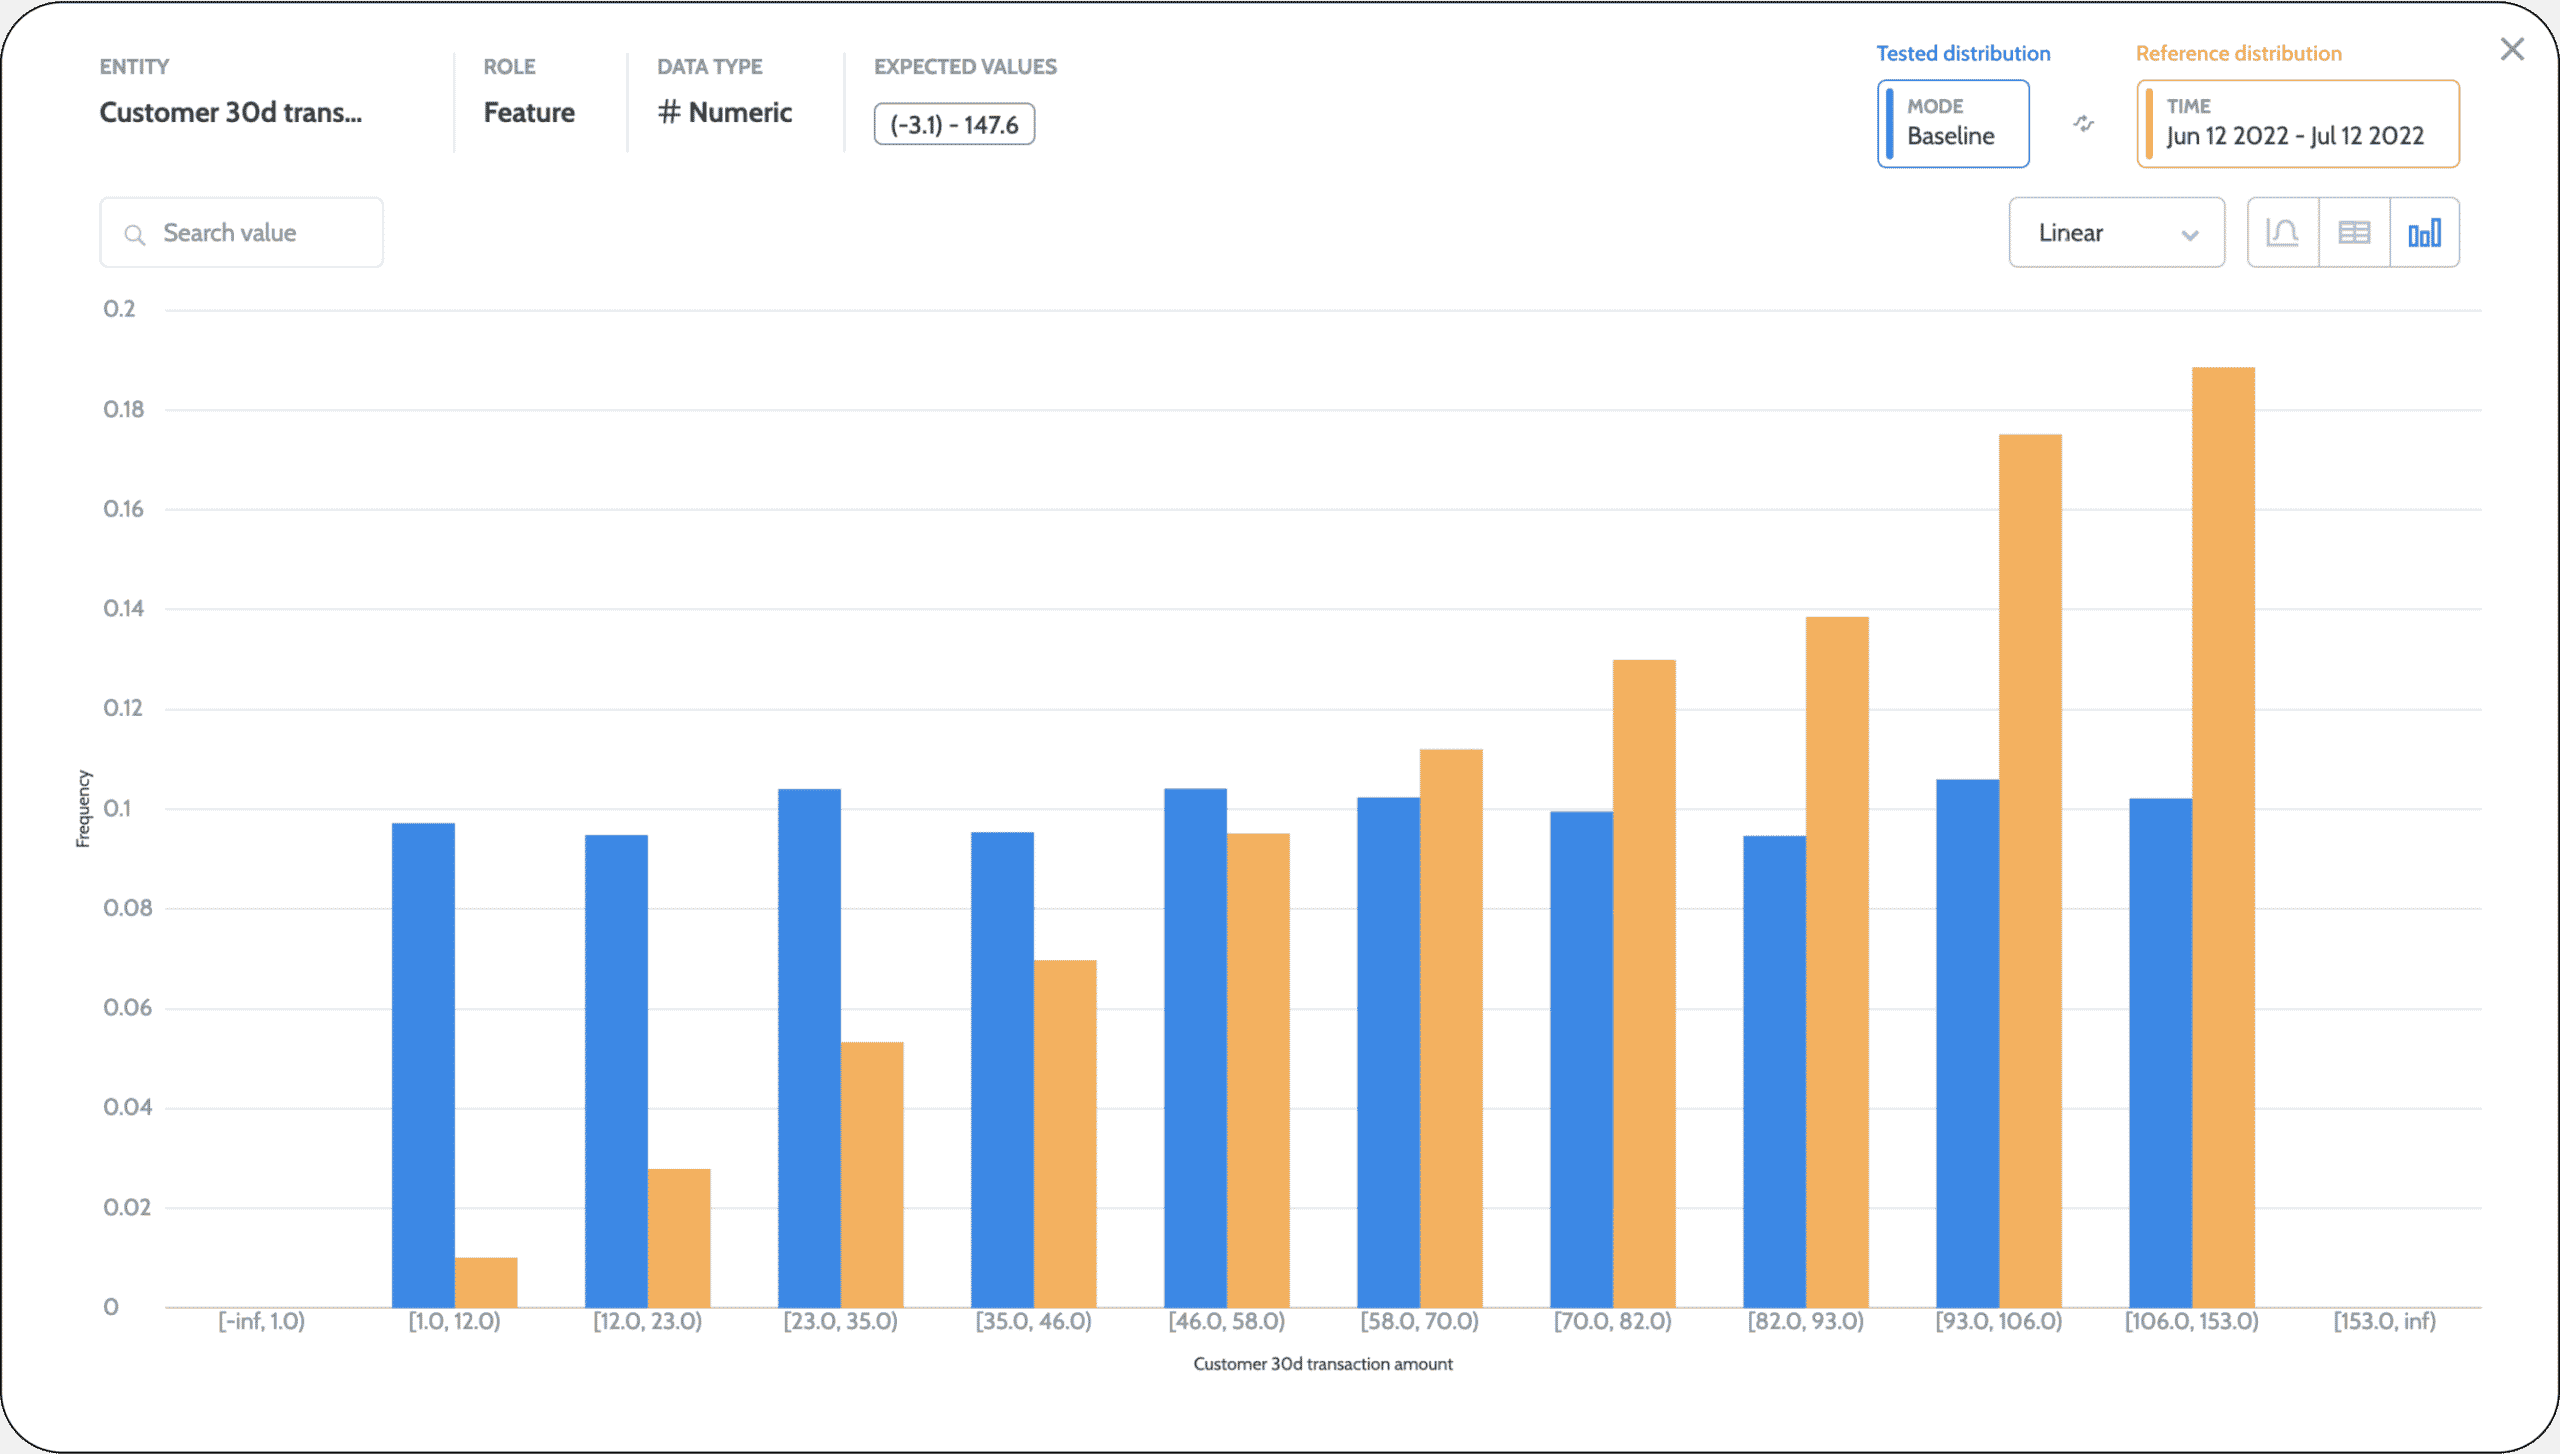
Measuring data drift is not straightforward. There are two main aspects to defining the right drift metrics. First, you need to understand which distribution you want to test and check if it’s drifting relative to the distribution you choose as your reference distribution. Second, you’ll need to decide how to quantify the distance between these two distributions.
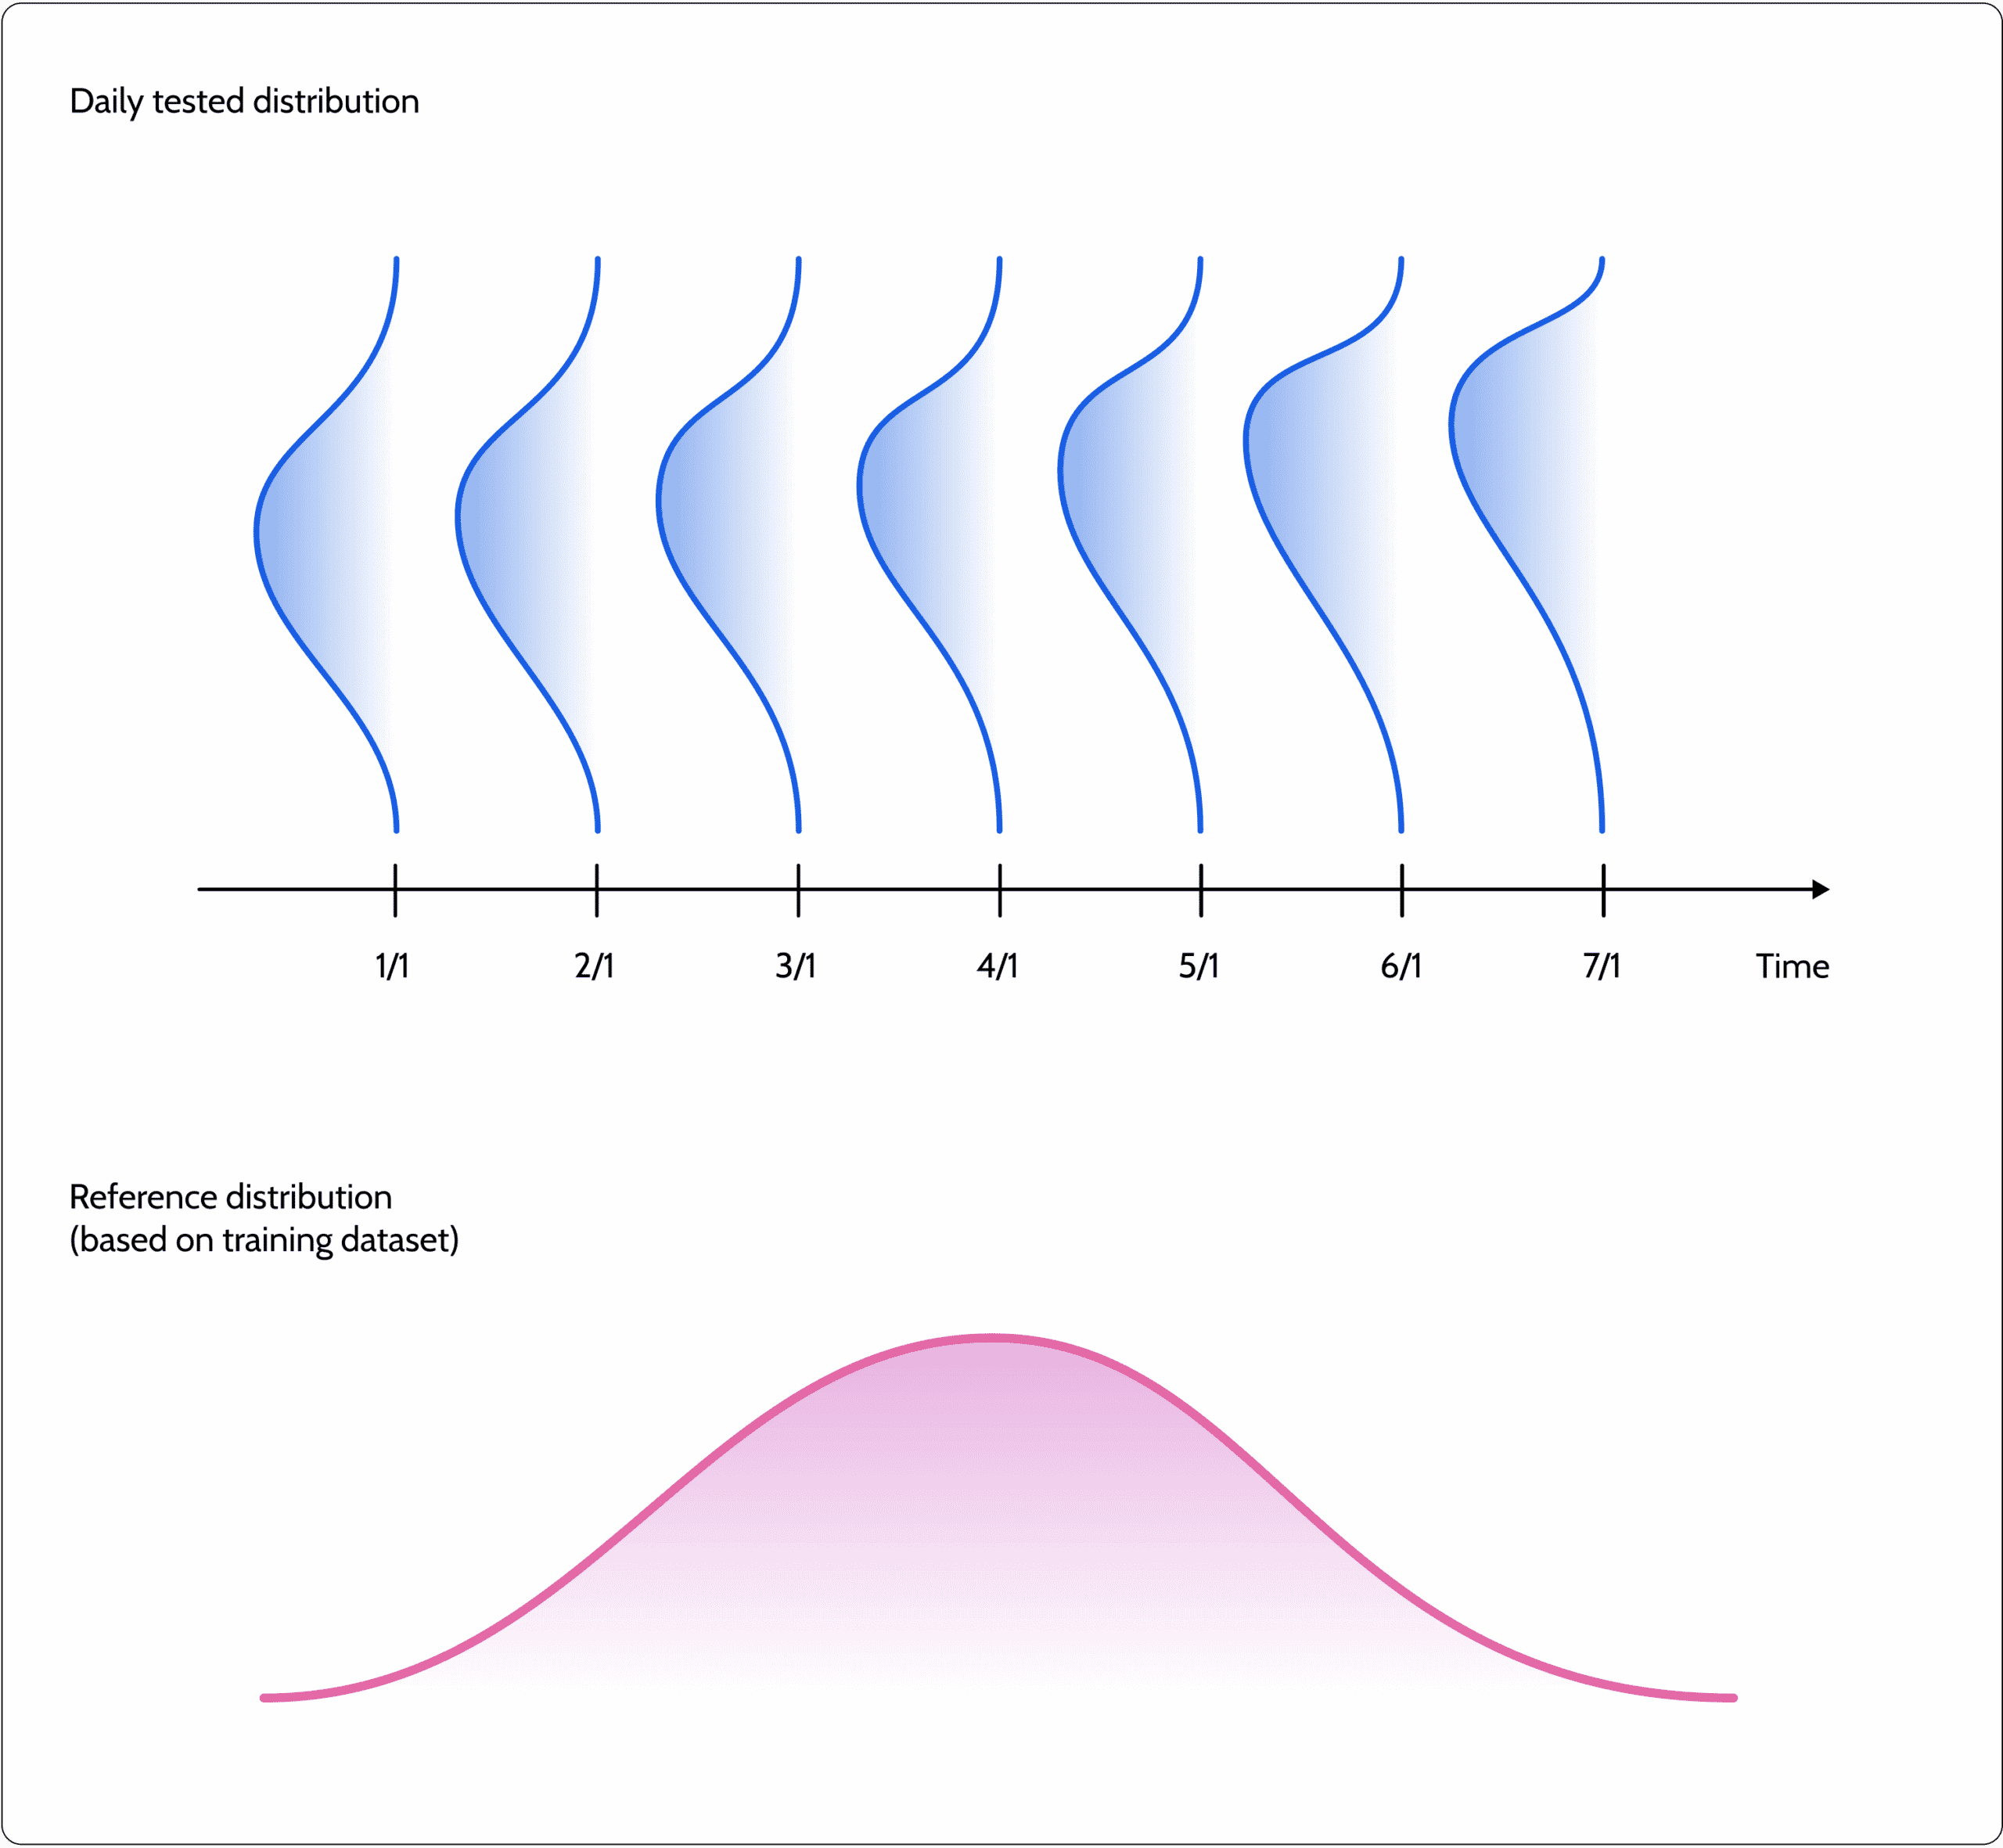
Measuring drift usually implies having a tested distribution that is drifting from a given reference distribution. What we should consider as the tested period and what we should consider as the reference distribution for comparison should be customized on a case-by-case basis.
In operational systems, we generally use a sliding window to compare and test our distribution over time. The big question is what time resolution to use: the last minute, last day, week, or month? Defining a shorter time resolution enables you to capture drift cases faster but also has the potential to be significantly noisier. Besides, even if you detect a drift in the last few minutes, you won’t necessarily have all the information needed to act on it and resolve the issue. You’ll need clear evidence over time to decide if you want to retrain the model. It’s best not to jump to conclusions before you are confident of the resolution required.
The most common use case for drift is to test for a training-serving skew. This means detecting whether the model in production is working under different circumstances than what was assumed when it was being trained. Usually, this can also be referred to as a type of uncertainty measure. However, in many cases (e.g., imbalance use case), the training dataset may not reflect the real-life distribution. How does this happen? We may have rebalanced classes, run stratified sampling, or other normalization methods that can impact the training dataset’s representation of real-life distribution. In these cases, it may be better to compare your production distribution to the test dataset, which was untouched and represents the actual distributions assumed.
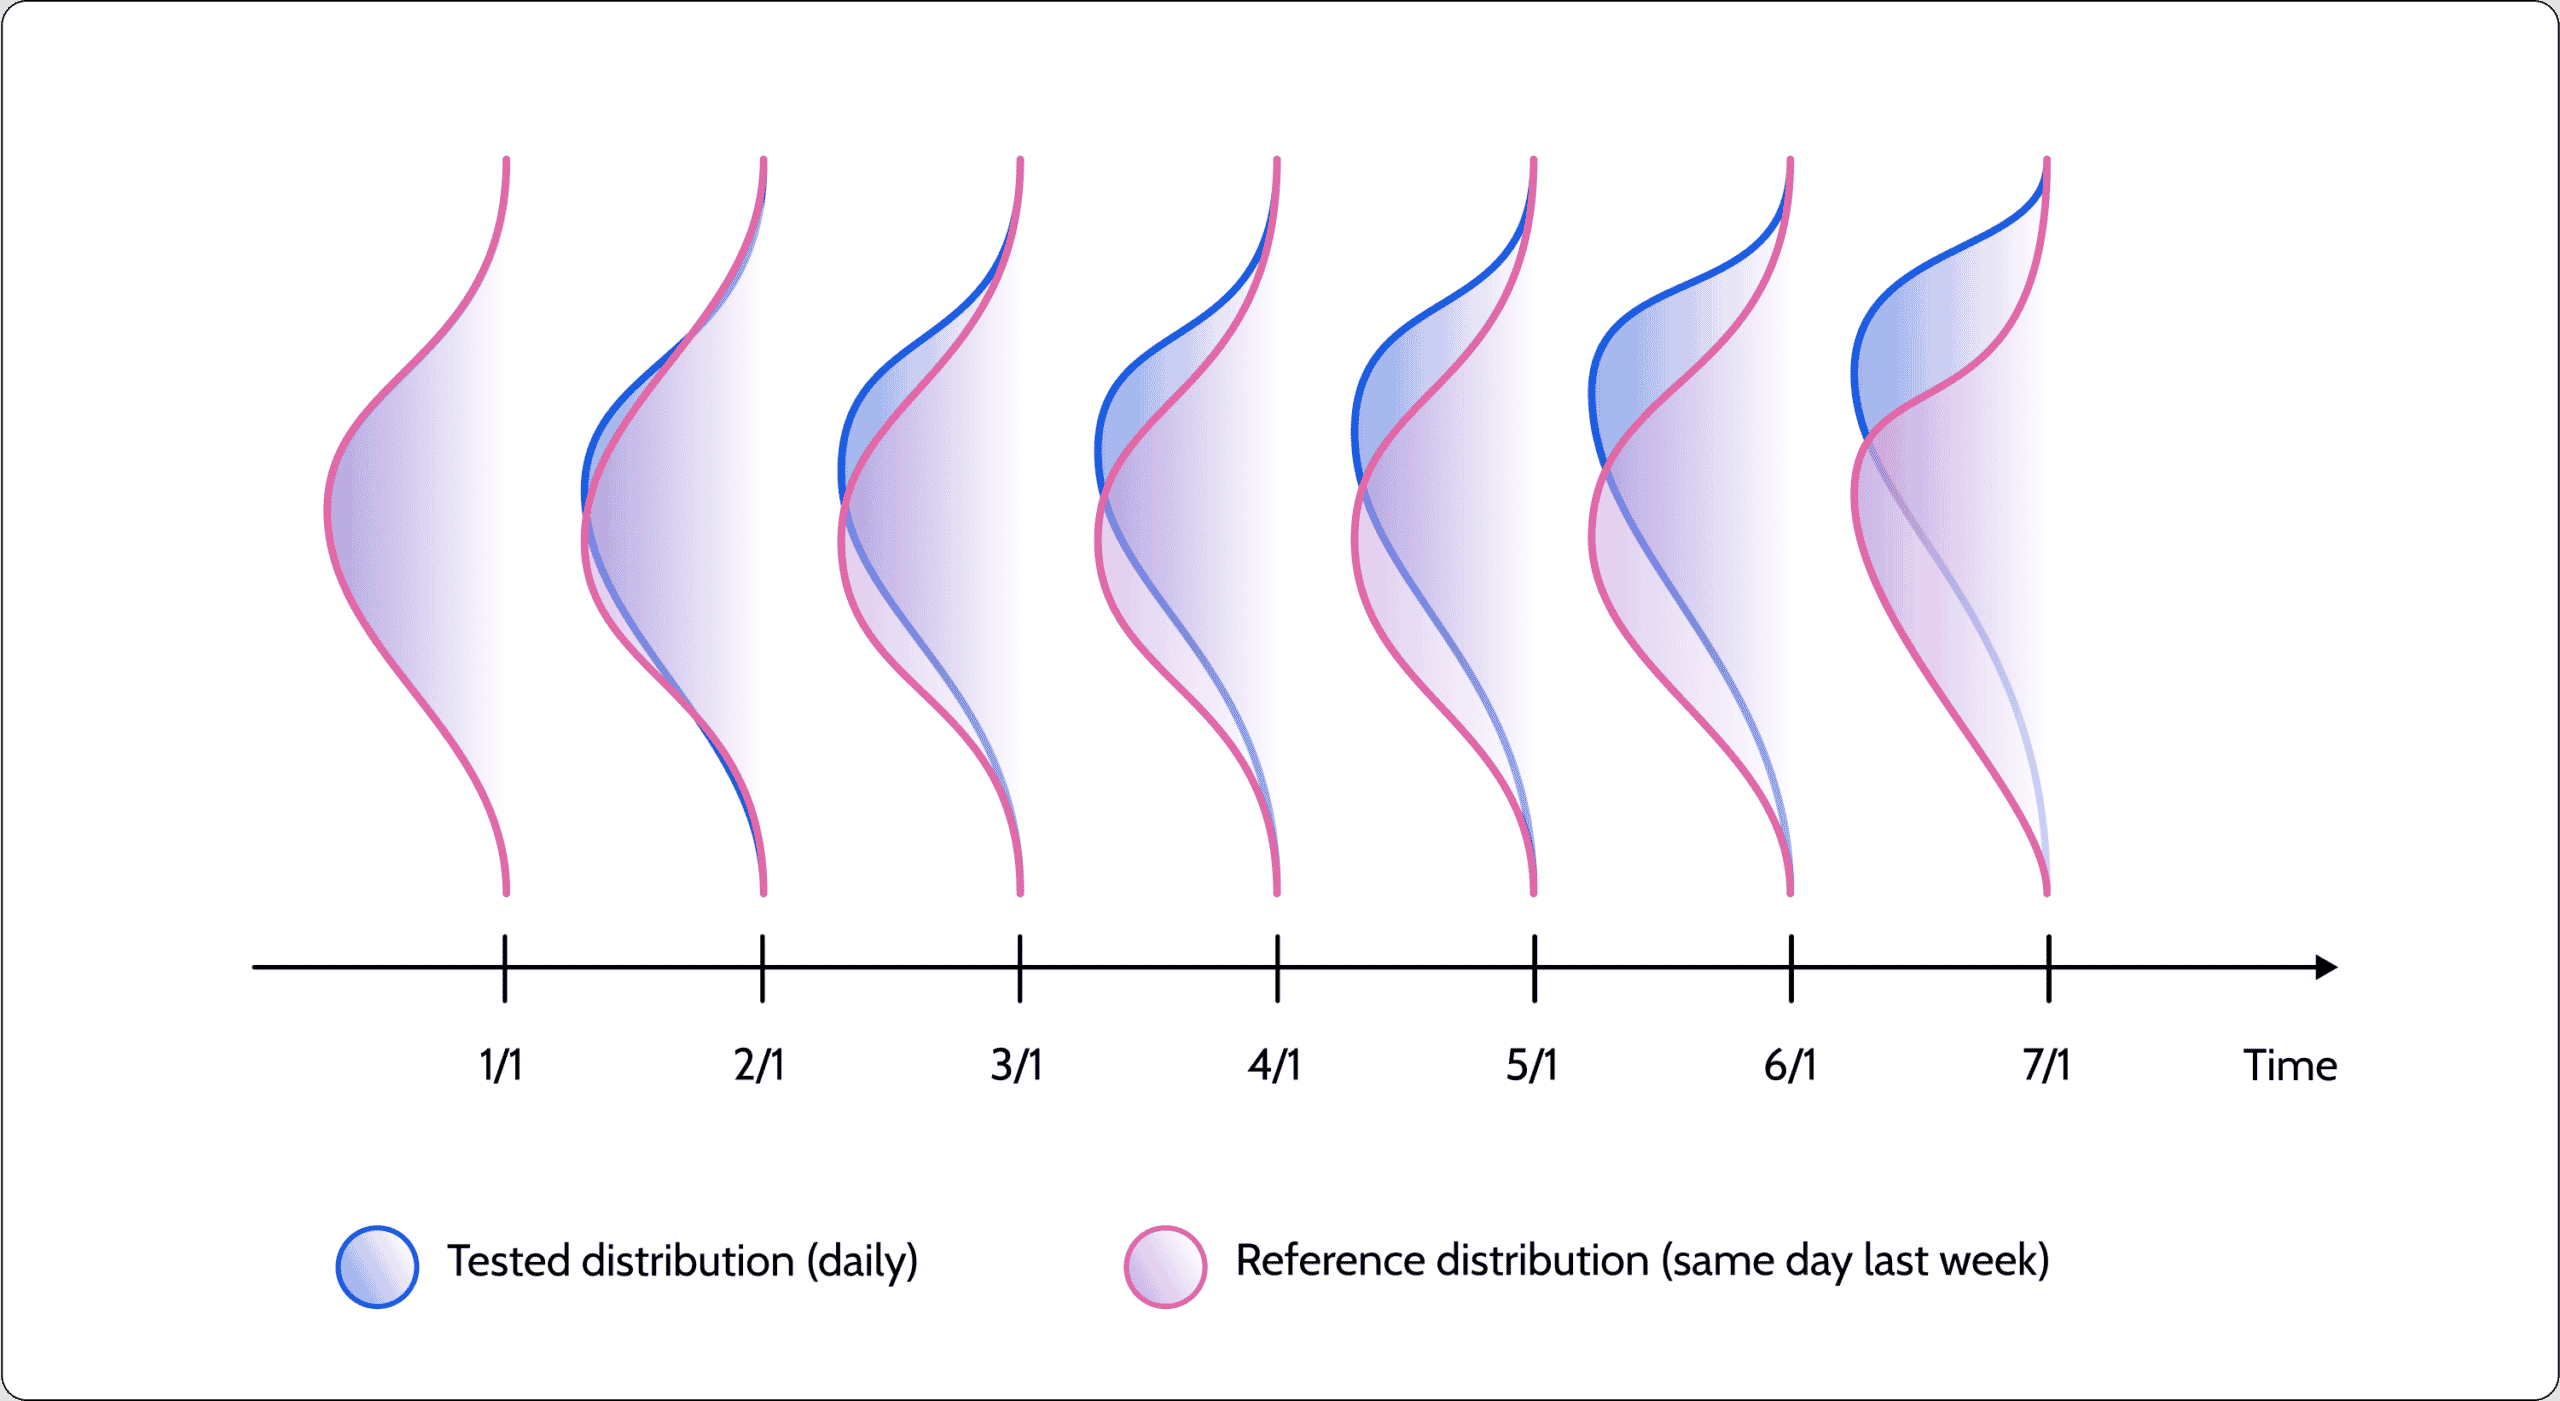
Another typical drift use case compares the tested distribution with a sliding window. For example, corresponding to a parallel day in the last week or even the previous month’s distribution. While this isn’t a good indication of the model’s uncertainty, it serves to highlight whether the underlying data distribution has been changing. It may be that the production distribution is actually becoming more similar to the original training dataset distribution but was very different from the distribution a week ago. Your knowledge of the use case and data should help you determine whether this is an anomaly or something completely normal. Using a sliding window reference distribution is very common in seasonality use cases, where we can test the tested distribution to the equivalent distribution a season ago.
Once you’ve decided what distribution you want to test and what reference distribution you want to compare it to, you need a mathematical function to help you quantify the drift.
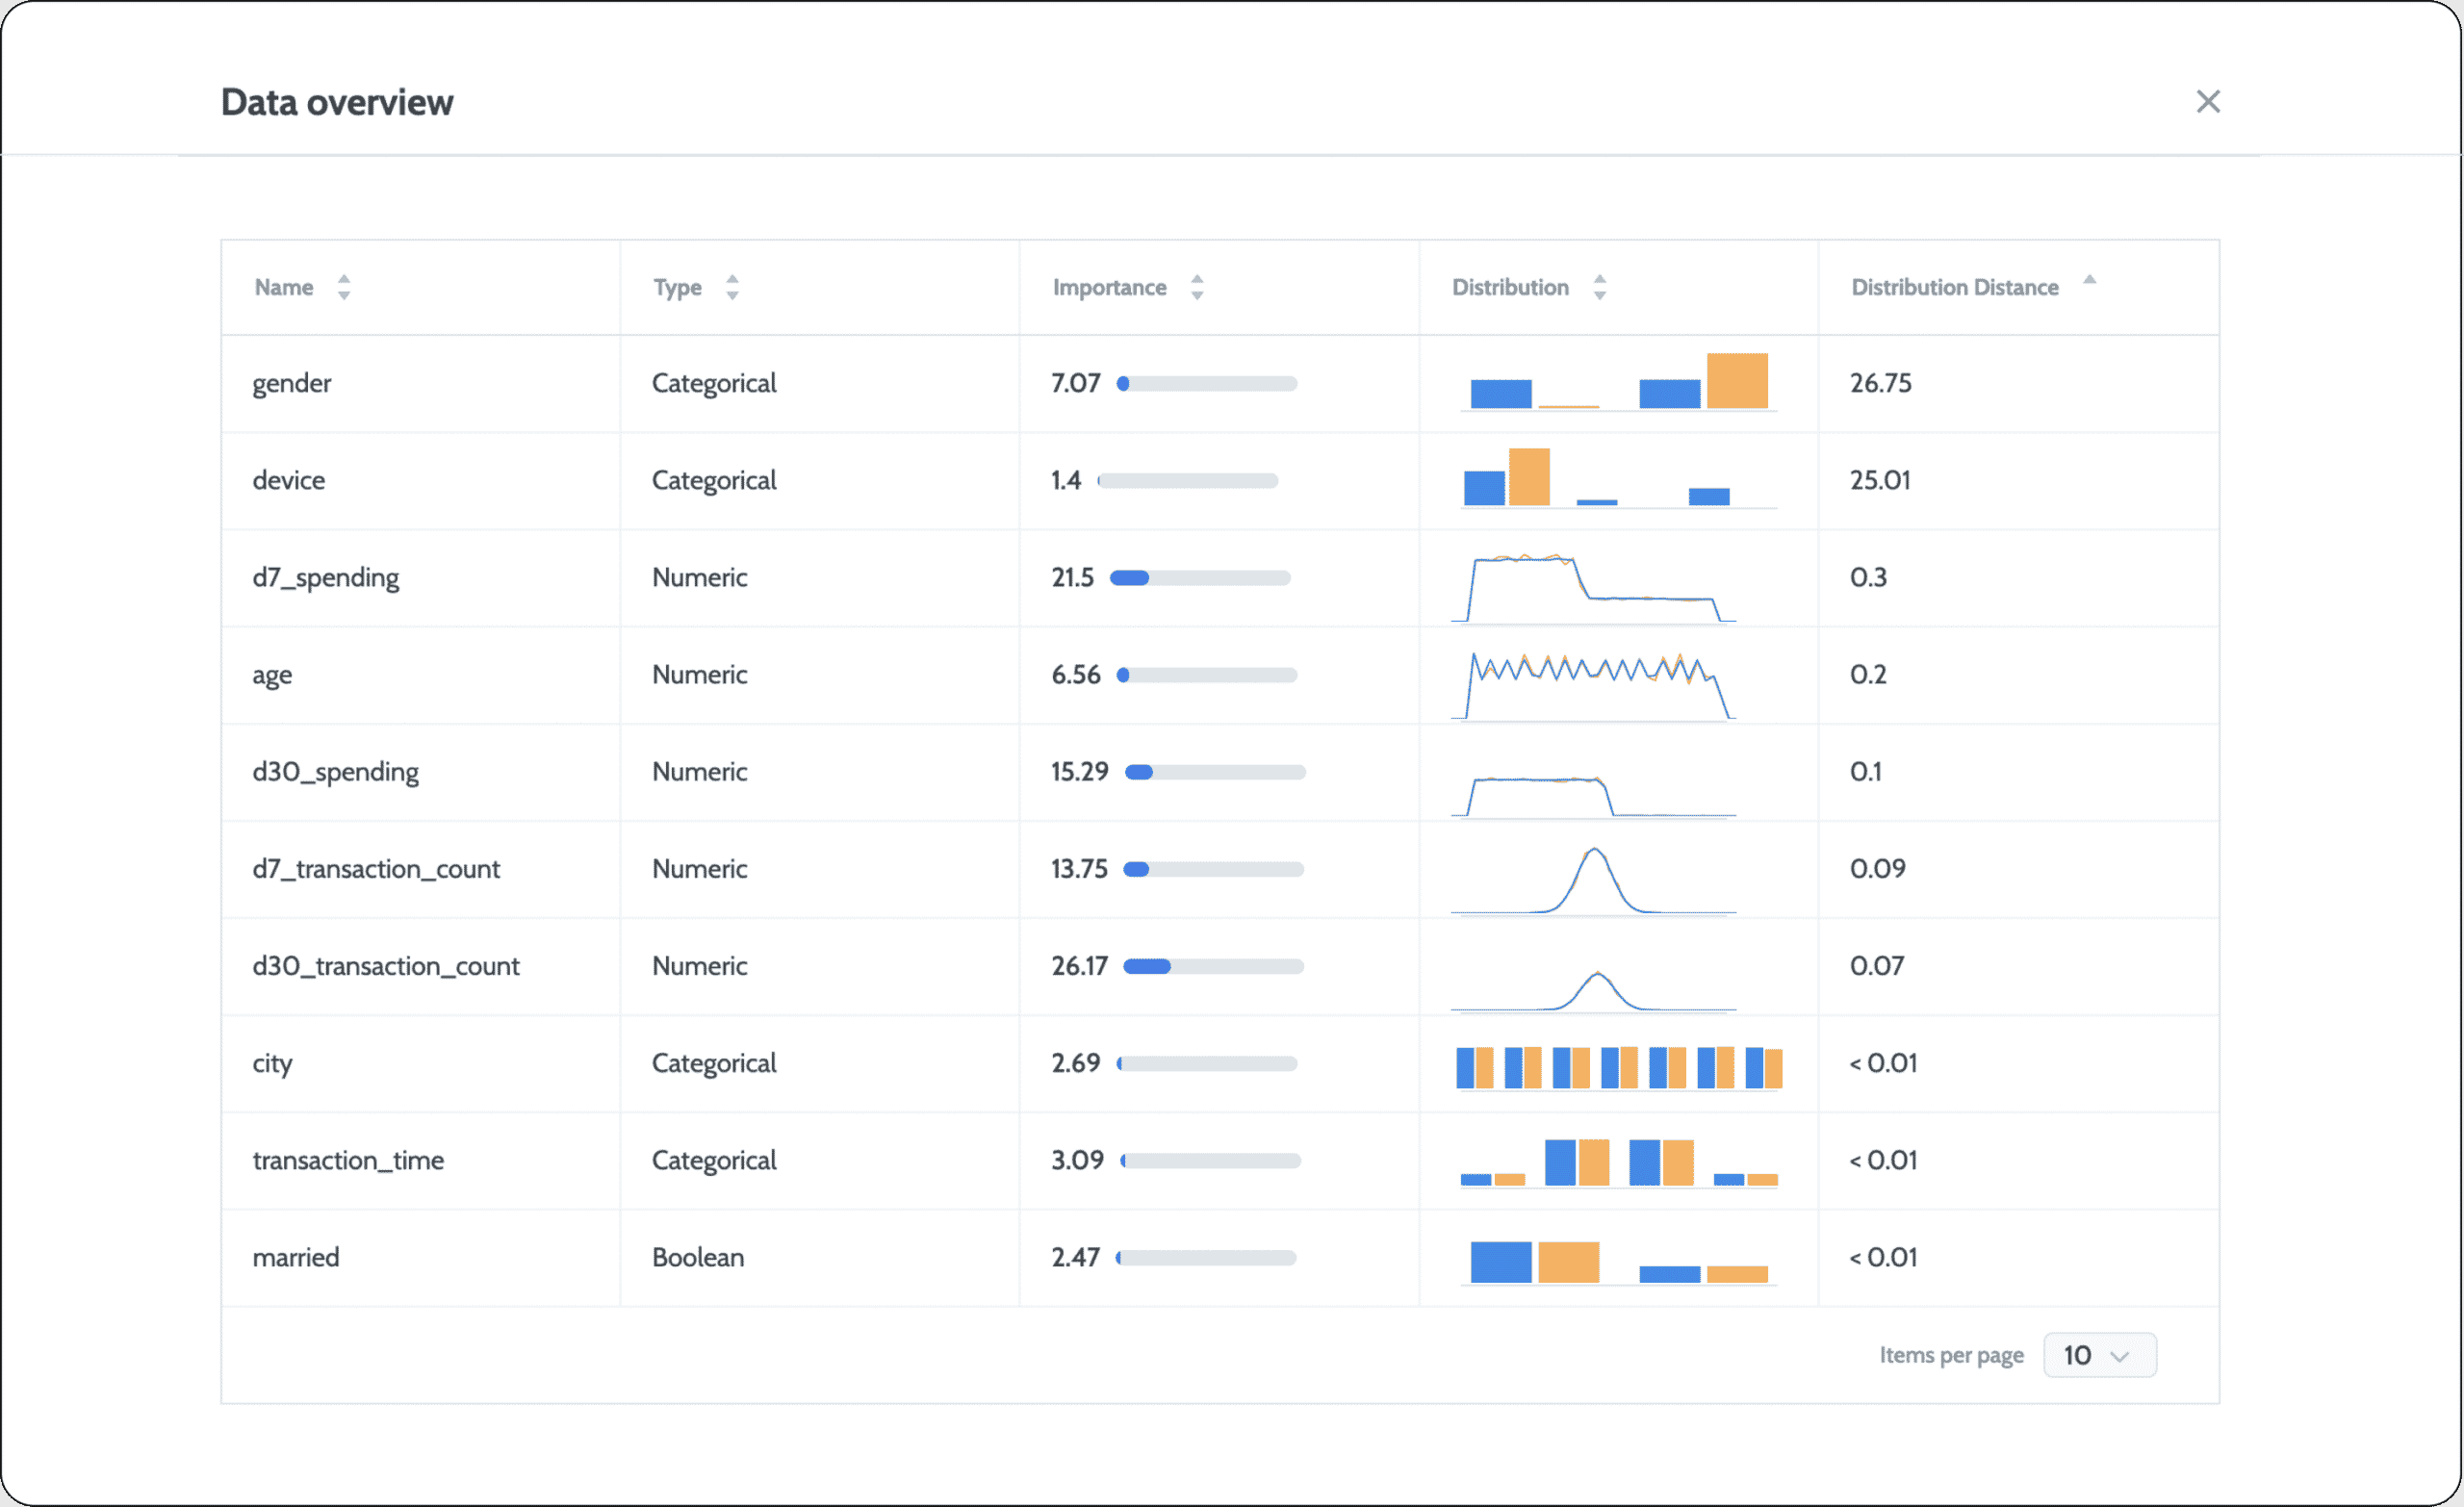
Many different statistical measures can be used to quantify the distance between the tested distribution and the reference distribution of a given feature. Each has its own properties, and some are model-based calculations. But, one of the key considerations for any type of quantification is how to incorporate drift into a single metric across the entire dataset. In short, you want to get one data drift score across all the features. Many machine learning models leverage dozens, hundreds, or even thousands of different features. In scenarios of high dimensionality, looking for drift only at the feature level will quickly lead to an overload of alerts due to the granularity of the measurement method. A common practice here is to quantify drift for the entire dataset together, a.k.a covariate drift. Once you see an indication of drift, you can drill down to understand precisely what is drifting and where it’s drifting.
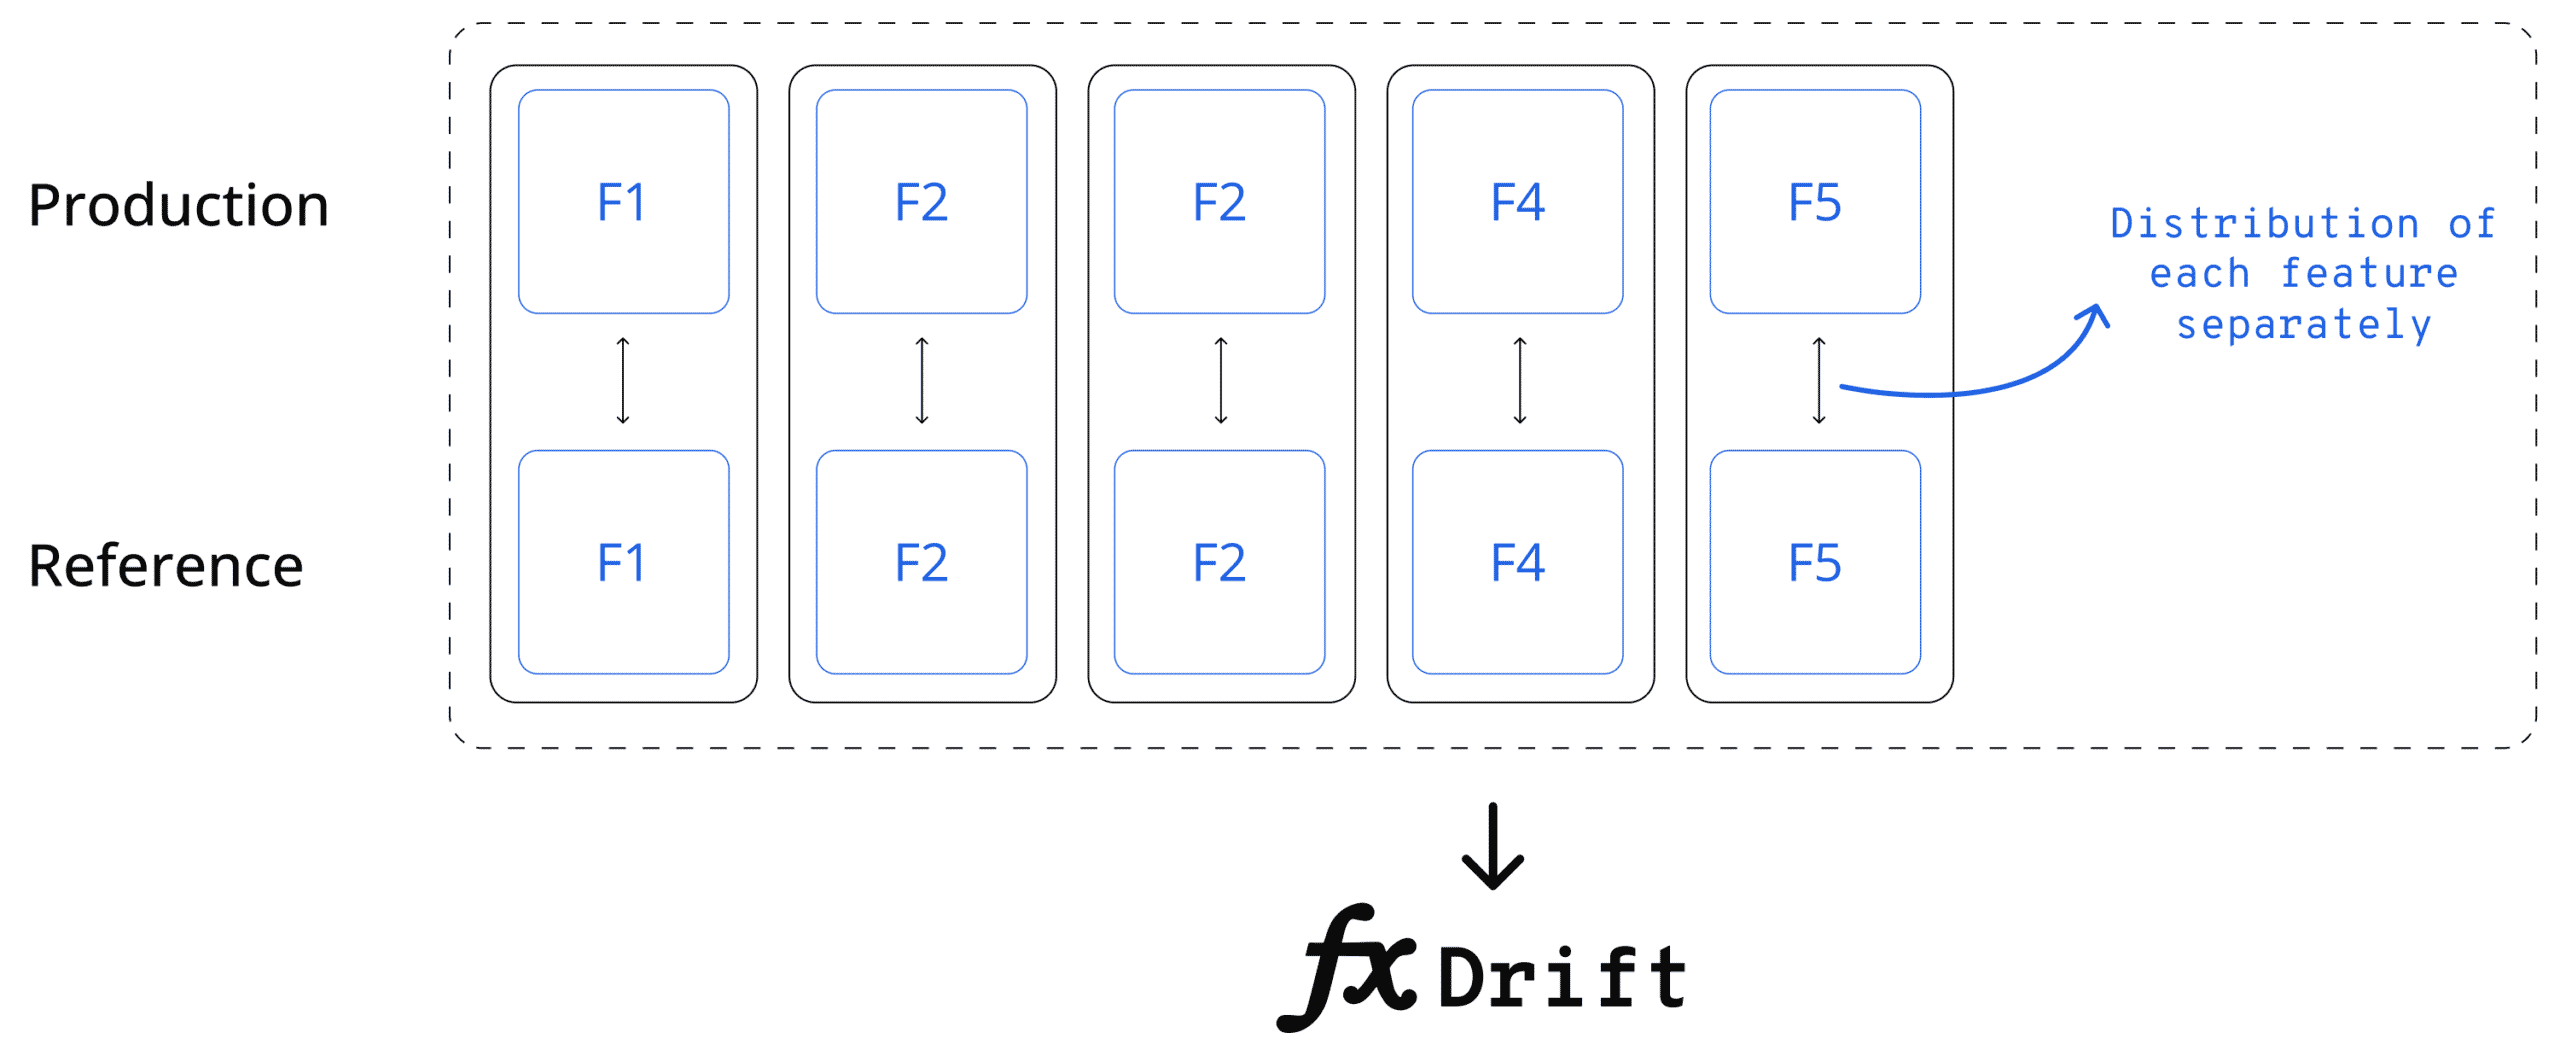
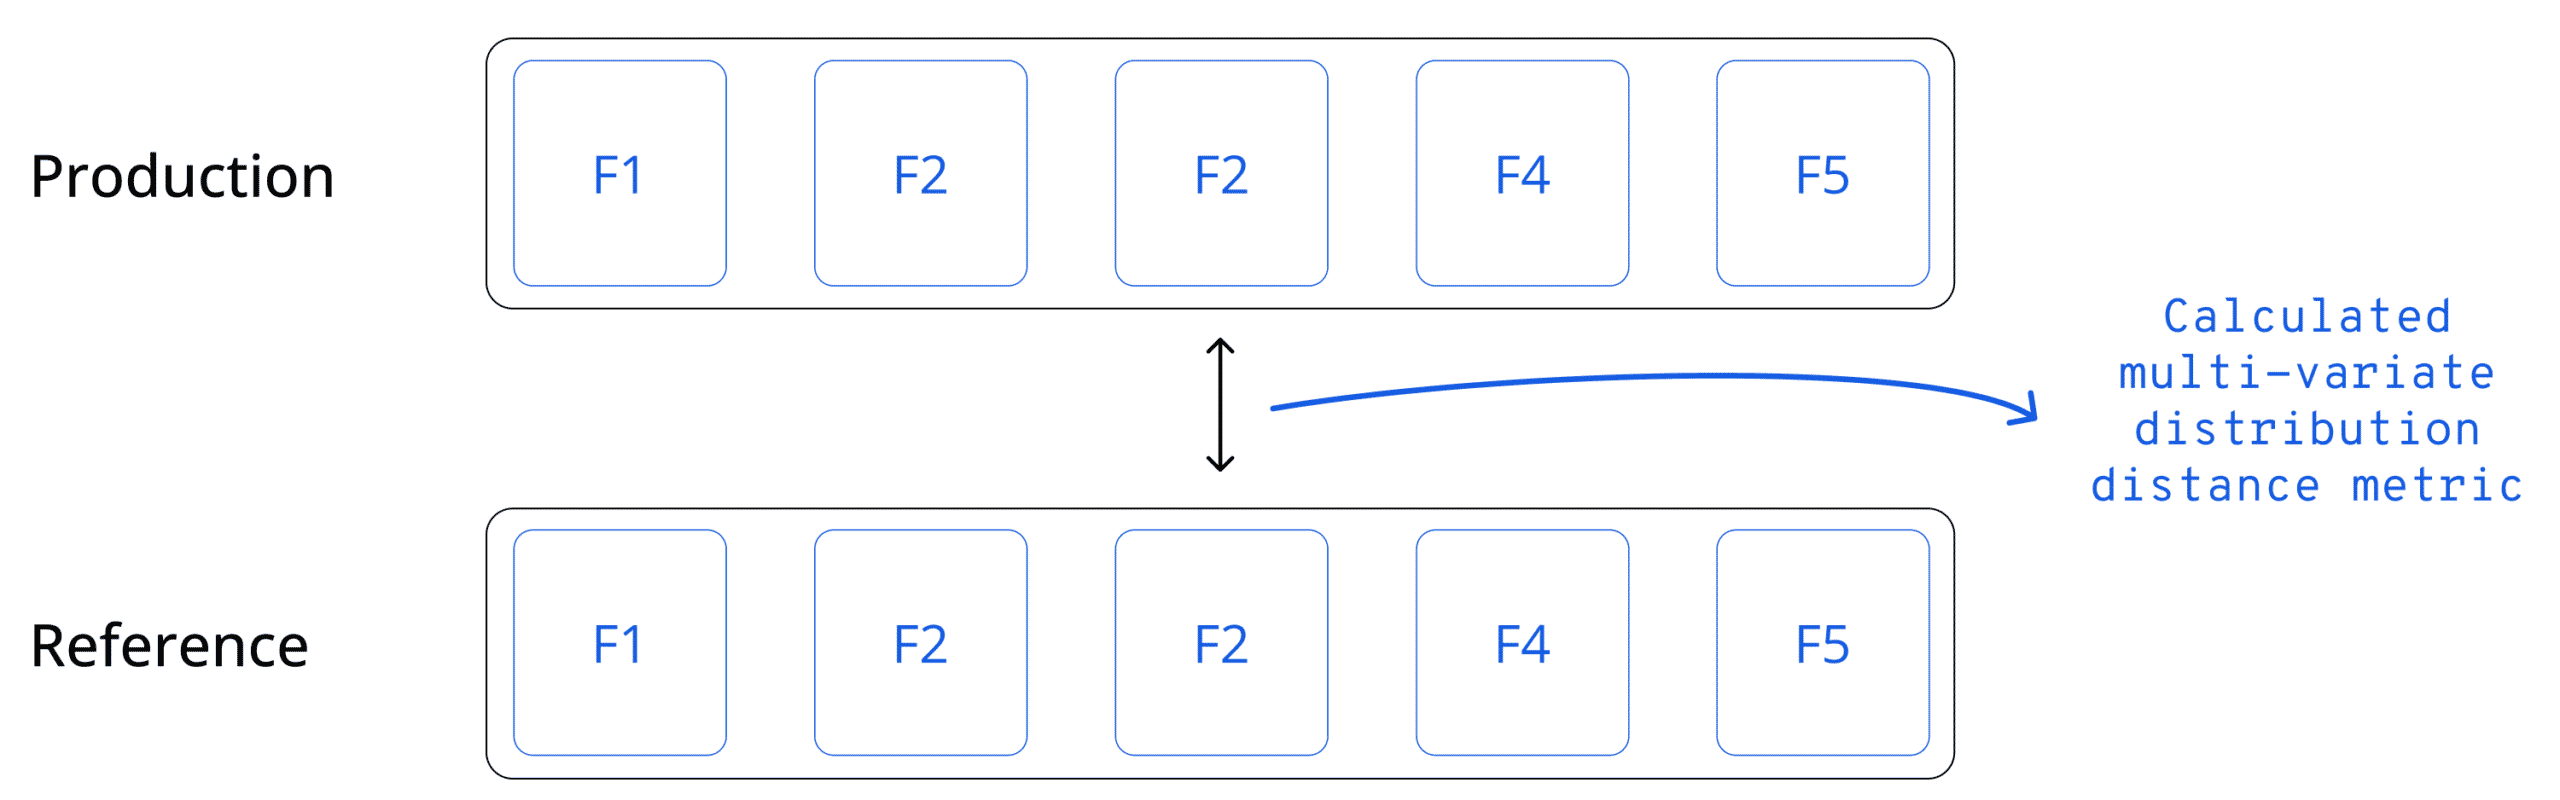
To quantify drift for the entire dataset, you can either compute the drift on a per-feature basis and then use some aggregation function to get a single aggregated drift metric. For example, you might compute the average drift level in all of the features to come up with a single score. You could even normalize this according to the importance of each feature (if available). Another option would be to leverage multivariate methods from the get-go. Below are some pros and cons of using the univariate approach.
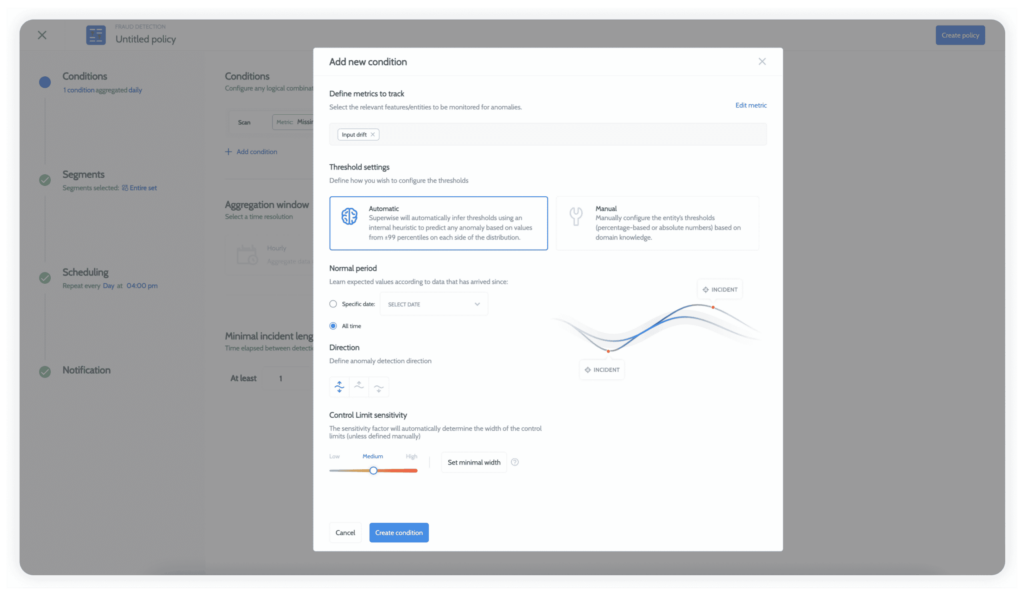
Monitoring data drift introduces many challenges beyond the need to define and measure drift correctly for each use case. One main challenge is defining thresholds. In traditional monitoring, we generally know what thresholds to use for monitoring and when we want to be alerted based on our domain expertise. For example, you may want to receive an alert if CPU use goes above 80%. With drift, different quantification methods can create different scales of values, and there is no clear definition for what constitutes a “bad” drift level. The general consensus is that the bigger the drift, the bigger the change, and the higher the chances we need to be notified. What makes the most sense when it comes to data drift is to measure the tested data drift and set thresholds–whether manual or dynamic–that are based on monitoring what goes above or below normal behavior over time.
While not all data drift will necessarily impact the performance of the process, it’s usually a good indicator that something isn’t working as expected or your model could be more optimized for the real world. Measuring and monitoring data drift is an essential aspect of any model monitoring activity. Which distributions you want to compare and what types of measures you should use require a deep understanding of your specific use case and business. Your ML observability platform should give you the flexibility to pick and choose between them all.
In our next posts on drift, we’ll take a deeper dive into common statistical and model-based metrics for measuring drift and best practices for handling drift once it is detected.
Head over to the Superwise platform and get started with drift monitoring for free with our community edition (3 free models!).
Request a demo and our team will show what Superwise can do for your ML and business.
Our previous post on understanding ML monitoring debt discussed how monitoring models can seem deceptively straightforward. It’s not as simple as it may appear and, in fact, can become quite complex in terms of process and technology. If you’ve got one or two models, you can probably handle the monitoring on your own fairly easily—and decide whether you should build or buy a tool. But once you scale your ML models in production, you may discover that you’ve inadvertently gotten yourself into a bad case of ML monitoring debt. This post offers some words of wisdom and just plain practical advice on identifying and dealing with this debt.
Your monitoring tool can’t accommodate new use cases
Different use cases require different performance metrics, monitoring strategies, and dashboards. Over the years, we’ve seen a number of experienced companies hit a wall when their use cases expanded. They started out with simple, in-house monitoring but turned to us when their custom tool couldn’t generalize for new use cases. The situation goes downhill fast when each team builds its own monitoring capabilities instead of having a centralized monitoring platform that can accommodate all the different–and future–use cases.
You’re firefighting issues your monitoring didn’t catch
The inherent challenge with monitoring machine learning is that ML makes predictions. Even if you have all the correct measurements in place, there’s no way to know for sure whether the algorithm is performing well unless your use case has ground truth feedback. Then you can know if the predictions are either right or wrong.
It’s not enough to simply measure your model’s performance. You need to be able to detect these uncertain situations where the algorithm makes predictions but has a high probability of getting them wrong, which means you also have to measure the data quality, level of drift, and more. Hunting down abnormal drift or data quality issues is tricky. And it’s something you can’t easily configure in advance. When it’s time to scale up your operation, you need to measure the entire process and go beyond it by ensuring you have advanced anomaly detection or trend detection capabilities. This way, you can more quickly understand when and where things go wrong in different models.
You are drowning in alerts
Getting just the right amount of alerts is a delicate balancing act whenever you do any kind of monitoring. To few alerts can mean you miss important problems, but too many alerts can also mean you’ll miss incidents because they get lost in the overload. Regarding model and data monitoring, we are essentially monitoring a stochastic process usually applied at high dimensionality and large scale. This makes the predicament even more complex because it’s tough to define in advance what the right threshold is for each use case, every segment, or any feature. When the threshold isn’t right, there’s a good chance it will lead to an overload of unwanted noise that is neither actionable nor important.
There’s no clear workflow and stakeholder alignment.
One of the first challenges companies face when putting ML models into production is finding a way to standardize the process of detecting, dealing with, and resolving model-related cases– especially since these inevitably impact the business. What should the problem resolution workflow look like? Who is responsible for it? Will the same person handle every kind of alert?
When you’ve got a limited ML monitoring solution in place, it generally remains siloed and will be accessible to only a limited set of people–maybe just the data scientist. These solutions are generally restricted when it comes to defining different owners per use case, per workflow, or per issue.
The first thing to do when your monitoring method falls behind is to ask yourself whether you have the ability to identify problems in real-time—and not after the fact or as a result of something else. Once you can be sure you’re getting alerts when something goes wrong, you’ll be able to stop the debt from piling up even further.
Use case flexibility
Another critical task is to make sure your monitoring tool can give you visibility for multiple use cases and not just one type of data.
Incidents, not dashboards
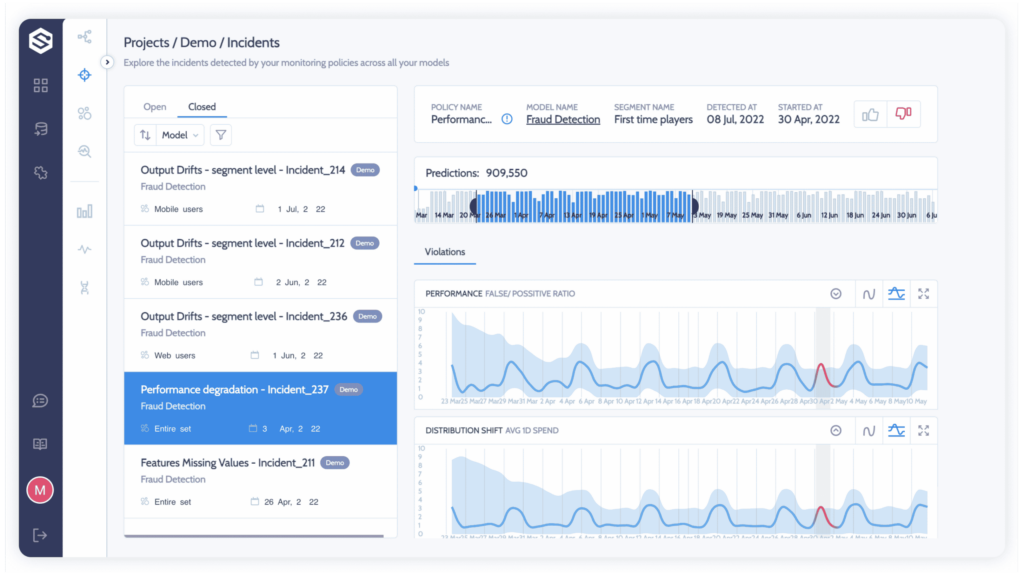
In a state of continuous alert fatigue, scientists and machine learning engineers can’t afford to analyze every issue, and uncovering the root cause is not a straightforward task. Practitioners need to dig into segments and resolutions to find the areas where models are performing worse than they could be or failing outright. With incident management, you can clearly see what went wrong and who was affected. This is a much higher level of abstraction than just looking at anomalies, and it will help you quickly identify and fix problems.
Superwise Incidents help you focus on what matters by automatically grouping issues and correlated events when your model starts to misbehave—generating a root-cause investigation view with precisely what you need to solve the problem at hand. This kind of focused view is essential for quickly identifying and solving problems.
If you’re swamped with alerts, check whether you can customize what you get and when. Make sure you can control the sensitivity of alerts so only those that really offer insight get through, it will be easier for you to identify the problem and how to fix it.
A system that doesn’t have the capabilities described here has the potential to drag you into debt. If your current method of ML monitoring doesn’t have them, this is the time to decide whether you can tweak your current setup or if you need to go all in for a new solution. Making thoughtful decisions about ML monitoring debt often involves learning more about the best practices and tools that are out on the market. This way, you can ensure you have the right features to truly understand how your model is working and when it stops working as planned.
Head over to the Superwise platform and get started with easy, customizable, scalable, and secure model observability for free with our community edition.
Request a demo and our team will show what Superwise can do for your ML and business.
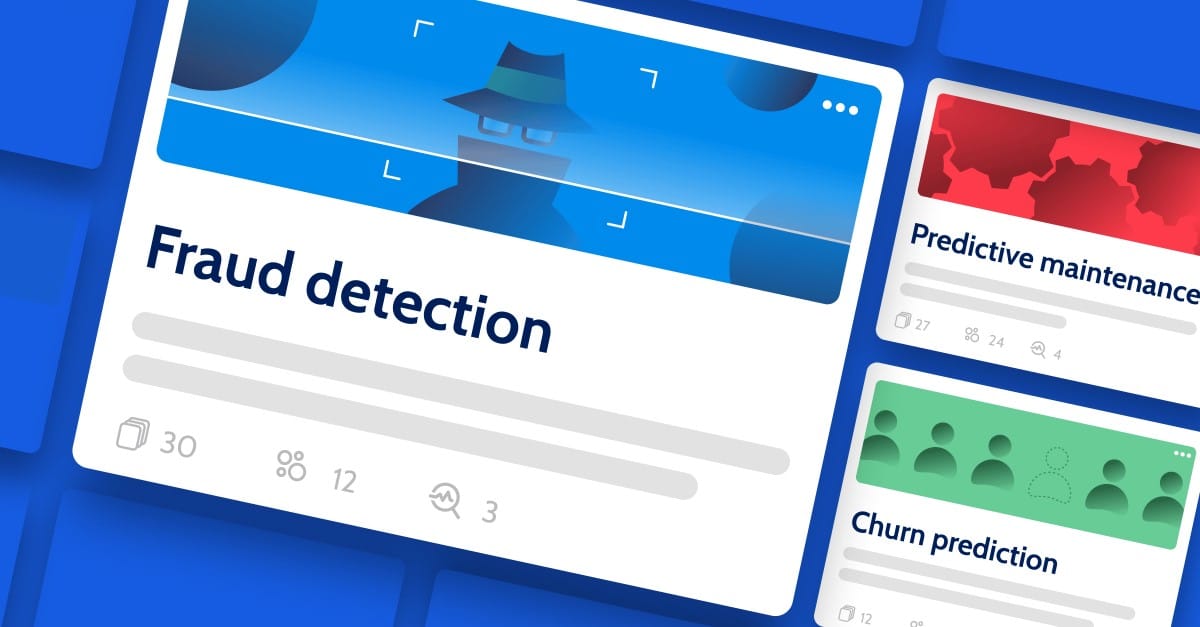
Over the last few years, ML is steadily becoming a cornerstone of business operations. Exiting the sidelines of after-hours projects and research to power core business decisions organizations depend upon to succeed and fuel their growth. With this, the needs and challenges of ML observability that organizations face are also evolving or, to put it more correctly, scaling horizontally.
In ML scale is a multifaceted challenge. Vertical scaling of predictions, horizontal scaling of models per customer, staggered models where the outputs of one model are the inputs of the next, and so forth. To address these advanced challenges, model observability, and ML monitoring must go beyond a singular model approach to facilitate model observability on a higher level of abstraction; observability of models on the project level.
Projects let you group or unite a group of models based on a common denominator. You can group models together around a shared identity, such as a customer or application, to facilitate quick access and visibility into groups, or you can create a functional group around a machine learning use case that will enable cross-model observability and monitoring.
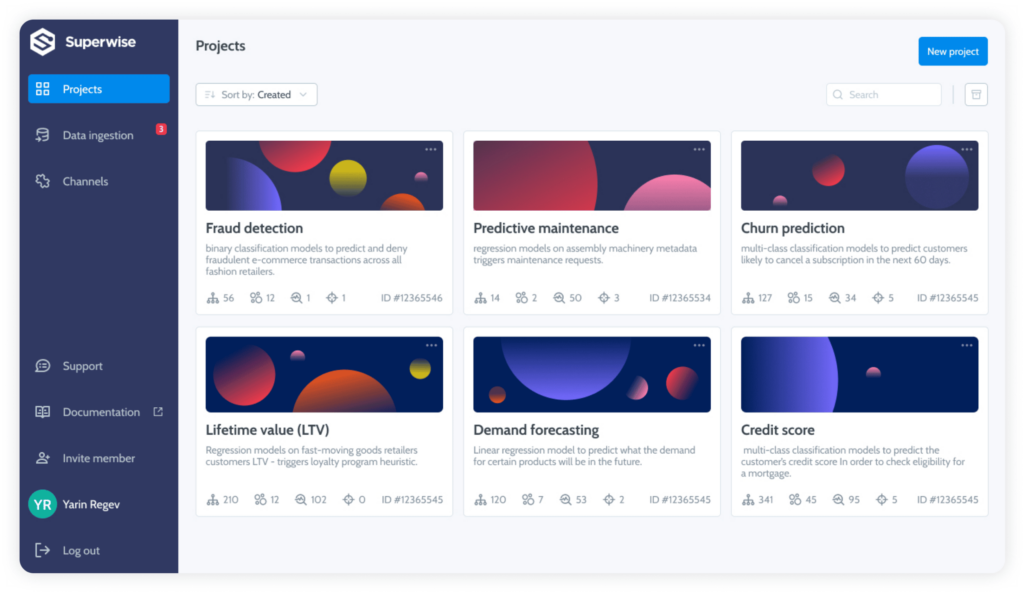
Within a functional project, configurations can be shared and managed collectively to utilize schema, metrics, segments, and policies across the entire project. This will significantly reduce your setup and maintenance time and help you get to value faster.
Metrics – In addition to all of Superwise’s out-of-the-box metrics, any custom metrics pertinent to your organization’s domain expertise and KPIs that you have built will be accessible throughout the project so you can quickly drill into behaviors on any entity level.
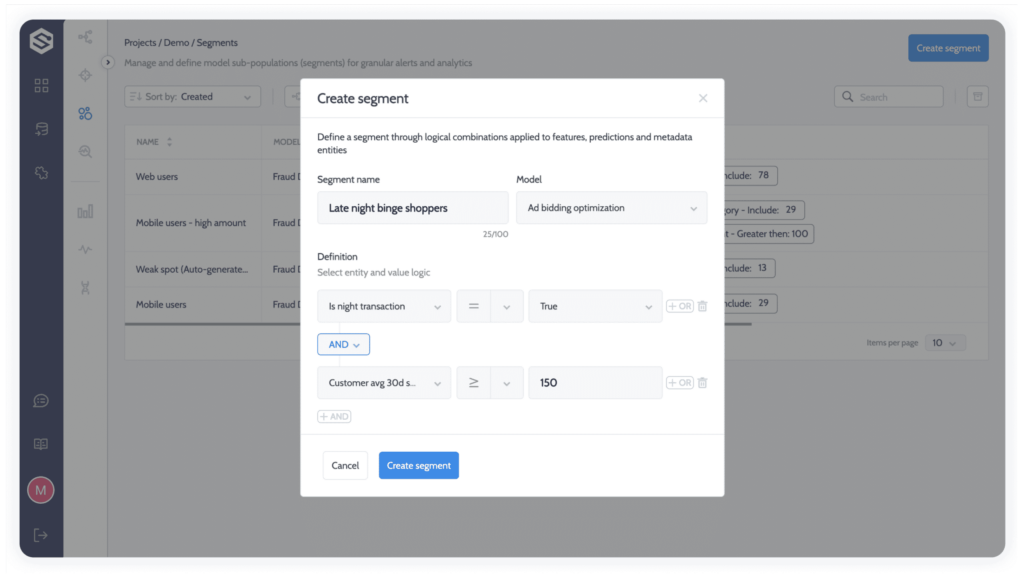
Segments – Segments, or sub-populations, can also be configured on the project level.
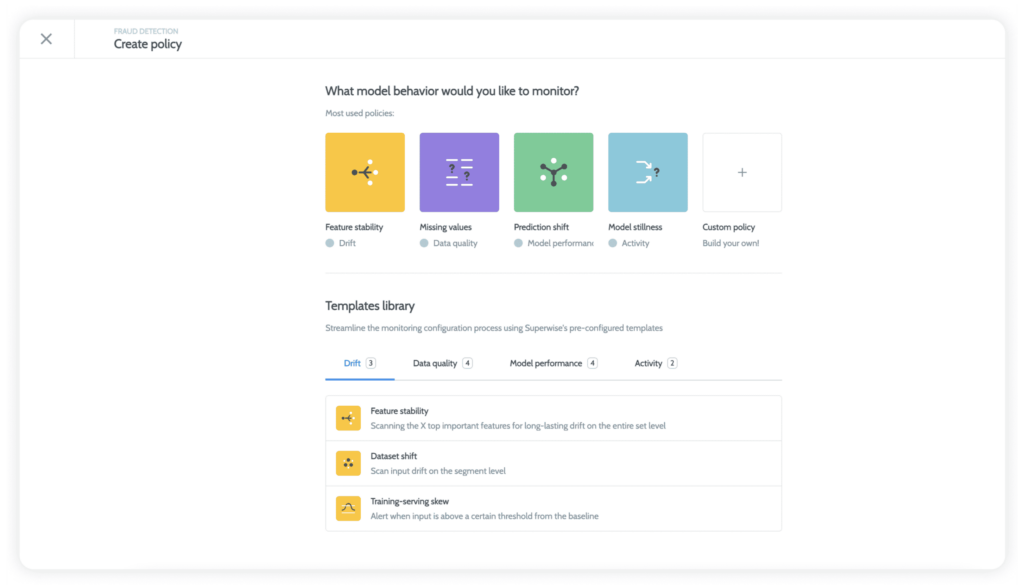
Policies – Don’t go and manually configure hundreds of policies and thresholds – turn to cross-project monitoring policies, with automatic threshold setup for each metric and entity based on time-series anomaly detection. You can build any custom policy that you need to support your use case.
Projects are much more than an accelerated path to efficiency in identifying micro-events, such as input drift on the model level. With projects, you can observe and monitor cross-pipeline macro-events like missing values, performance decay for a specific segment across all models, and so forth. Giving ML practitioners the ability to ask and answer questions like never before.
Request a demo and our team will show what Superwise can do for your ML and business.
This article will illustrate how you can use Layer and Amazon SageMaker to deploy a machine learning model and track it using Superwise.