5 ways to prevent data leakage before it spills over to production

Data leakage isn’t new. We’ve all heard about it. And, yes, it’s inevitable. But that’s exactly why we can’t afford to ignore it. If data leakage isn’t prevented early on, it ends up spilling over into production, where it’s not quite so easy to fix.

Data leakage in machine learning is what we call it when you accidentally gave your machine learning model the answers instead of it learning how to predict on its own. It can happen to anyone, whether because incorrect data was fed to the algorithm during training or the prediction was included in your data by mistake. Either way, if your model gets hold of data it wasn’t supposed to see during training, it can become overly optimistic, invalid, or unreliable–and will output bad predictions.  

The reality is that almost every data scientist is at risk of data leakage at some point. We all know the obvious common leakages, like including the label as one of the features or leaving the test set as part of the train set, but actually, there are many types of data leakage patterns. It may happen when you clean your data, remove outliers, separate off the test data, or during just about any other data processing. The bottom line is that when there’s data leakage, you don’t know how good the model is, and you can’t trust it to be accurate. Needless to say, if left unchecked, data leakage is much harder to fix once your model goes to production.

How to detect data leakage

Many types of data leakage are subtle, but you can ferret them out early with a few proactive strategies.

1. Check whether your results are too good to be true

If you’re seeing results that are 100% accurate, there’s clearly something wrong. But to understand what levels of accuracy should raise a data leakage flag, try to get some sort of benchmark. This might be your current performance or performance based on a very basic modeling process where you’re less likely to make mistakes. Use that baseline to see if your model’s results are in the same ballpark; they should be better but not on a different scale.

If it looks too good to be true it's probably data leakage
If it looks too good to be true, it’s probably data leakage

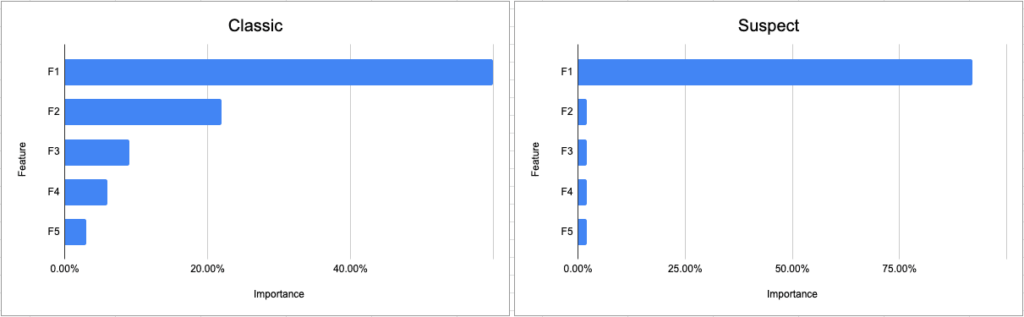
2. See if a single feature stands out as significantly more important than others

It’s always worth running an analysis for feature importance or correlation to understand how different features influence the decision-making process. This analysis is also a good way to capture suspicious leaks. Say your model needs to predict who should receive approval for a loan from the bank. If your analysis shows a single feature–like age–that is being used to formulate 80% of the decision, and all the other features like profession, sex, income, family status, and history make up 20%, it’s time to go back and check for leakage. Feature attribution analysis is also very effective in capturing label leakage or label proxy elements, where the predicted value was part of the features used to build the model.

Classic vs suspect feature importance

3. Get a visual to confirm the intuition behind the decision-making

If you’re using a white box algorithm that’s understandable and transparent, try to get a visualization to see how the predictions are being made. For example, if the model uses a decision tree, glance over the pattern to see if it’s odd-looking, counterintuitive, or overloaded in one area as opposed to the others. But not all models are white-box and can be followed. For your black-box models, you can use explainability methods like SHAP or LIME. These tools will run sensitivity analysis on your algorithms to explain the output and pinpoint any features that are dominating the prediction. If the predictions seem to be working but are based on things that shouldn’t carry so much weight, take another look and think about running it by a domain expert.

4. Have other practitioners do a peer code review

Having colleagues review your code is standard for software engineering but somehow isn’t a must for data science. Everyone tends to have bugs in their code, so why not in their models? Don’t be shy: organize a data science design review to go over the approach and modeling process, simulate how the algorithm runs, and catch unwanted bugs that might lead to leakage.

5. Vet that the held-out data was separated before data manipulation

When you split a dataset into testing and training, it’s vital that no data is shared between these two sets. After all, the whole idea of the test set is to simulate real-world data that the model has never seen. If you get started with data manipulations and transformations before you separate the hold-out data, there’s a good chance your data will leak. What’s more, if you find out that the hold-out data wasn’t separated at the outset, you should seriously consider starting over. Either way, check the process to see when the data was held out.  

Recognizing data leakage in production versus training

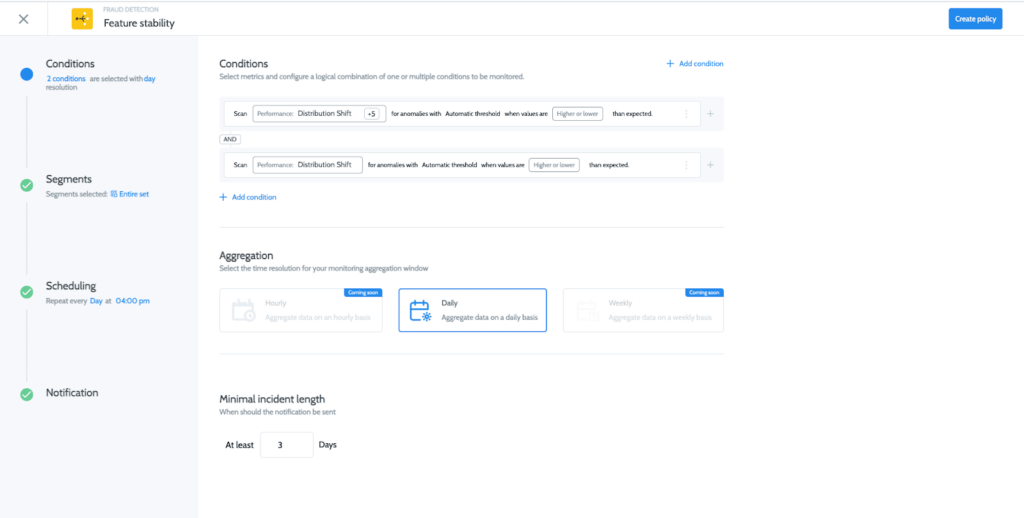
These strategies come into play while you’re training your model. Unfortunately, data leakage is still common and tends to ‘somehow’ slide over into production. This fact underlines the importance of a monitoring platform that can detect underperforming models or distribution skews as soon as the model begins working in production.  

Ready to get started with Superwise?

Head over to the Superwise platform and get started with easy, customizable, scalable, and secure model observability for free with our community edition.

Prefer a demo?

Request a demo and our team will show what Superwise can do for your ML and business. 

Recommended reading:

How to Avoid Data Leakage When Performing Data Preparation

Tutorial on how to find and fix data leakage

Overfitting vs. Data Leakage in Machine Learning

Show me the ML monitoring policy!

Model observability may begin with metric visibility, but it’s easy to get lost in a sea of metrics and dashboards without proactive monitoring to detect issues. But with so much variability in ML use cases where each may require different metrics to track, it’s challenging to get started with actionable ML monitoring. 

If you can’t see the forest for the trees, you have a serious problem.

Over the last few months, we have been collaborating with our customers and community edition users to create the first-of-its-kind model monitoring policy library for common monitors across ML use cases and industries. With our policy library, our users are able to initialize more and more complex policies rapidly, accelerating their time to value. All this is in addition to Superwise’s existing self-service policy builder that lets our users tailor customized monitoring policies based on their domain expertise and business logic. 

The deceptively simple challenge of model monitoring

On the face of things, ML monitoring comes across as a relatively straightforward task. Alert me when X starts to misbehave. But, once you take into consideration population segments, model temporality and seasonality, and the sheer volume of features that need to be monitored per use case, the scale of the challenge becomes clear.   

Superwise’s ML monitoring policy library

The key to developing our policy library was ensuring ML monitoring accuracy and robustness while enabling any customization in a few clicks. All policies come pre-configured, letting you hit the ground running and get immediate high-quality monitoring that you can customize on the fly. 

Customizable ML policies

The monitoring policy library

The policy library covers all of the typical monitoring use cases ranging from data drift to model performance and data quality. 

How to add a monitoring policy

Drift 

The drift monitor measures how different the selected data distribution is from the baseline.

Drift documentation

Model performance 

Model performance monitors significant changes in the model’s output and provides feedback as compared to the expected trends.

Model performance documentation

Activity

The Activity monitor measures your model activity level and its operational metrics, as variance often correlates with potential model issues and technical bugs.

Activity documentation

Quality

Data quality monitors enable teams to quickly detect when features, predictions, or actual data points don’t conform to what is expected.

Quality documentation

Custom

Superwise provides you with the ability to build your own custom policy based on your model’s existing metrics.

Any use case, and logic, any metic fully customizable to what’s important to you. 

Read more in our documentation

Ready to get started with Superwise?

Head over to the Superwise platform and get started with easy, customizable, scalable, and secure model observability for free with our community edition.

Prefer a demo?

Request a demo and our team will show what Superwise can do for your ML and business.

Sagify & Superwise integration

A new integration just hit the shelf! Sagify users can now integrate with the Superwise model observability platform to automatically monitor models deployed with Sagify data drift, performance degradation, data integrity, model activity, or any other customized monitoring use case.

Why Sagify?

Sagemaker is like a Swiss army knife. You get anything that you could possibly need to train and deploy ML models, but sometimes you just need a knife, and this is where Sagify comes in. Sagify is an open-source CLI tool for Sagmaker that simplifies training and deploying ML models down to two functions, train and predict. This abstracts away a lot of the low-level engineering tasks that come along with Sagemaker.

What you get with Sagify + Superwise

Now that Sagify has simplified Sagemaker training and deployment, the Sagify & Superwise integration streamlines the process of registering your new model and training baseline to Superwise’s model observability platform. This lets you hit the ground running because once you’ve initialized, you get train-deploy-monitor all in one run. Superwise will infer all relevant metrics out-of-the-box (In addition, you can also add customized metrics unique to your use case and business). This way, you don’t need to invest time in configuring model metrics. You can focus on detecting issues like drift, performance degradation, data integrity, etc., to resolve issues and improve your models faster.

Build or buy? Choosing the right strategy for your model observability

If you’re using machine learning and AI as part of your business, you need a tool that will give you visibility into the models that are in production: How is their performance? What data are they getting? Are they behaving as expected? Is there bias? Is there data drift? 

Clearly, you can’t do machine learning without a tool to monitor your models. We all know it’s a must-have tool, but until recently, most organizations had to build it themselves. It’s true that companies the size of Uber can build a solution like Michelangelo. But for most companies, building a monitoring platform can quickly transition into something kludgy and complex. In the article understanding ML monitoring debt, we wrote about how monitoring needs have a tendency to scale at warp speed and you’re likely to find that your home-grown limited solution is simply not good enough.

This article will help you with some of the key advantages of using a best-of-breed model observability platform like Superwise versus building it yourself.

Let’s compareBuildBuy
Time to value1 – 2 years for MVP.1 day
Required effort3 – 5 data scientists and machine learning engineers to build MVP for 2 years.1 engineer to integrate with Superwise.
Total cost of ownership30% of DS and MLE time to maintain and adjust a limited solution and react to ongoing business issues through troubleshooting.Easily expands for new use cases and accommodates maintenance, upgrades, patches, and industry best practices.
StandardizationNone.
Different DS and MLE teams can use different tools, metrics, or practices to measure drift, performance, and model quality.
Built-in.
Multiple teams can work on different ML stacks and use one standard method for measurements and monitoring.
One source of truthDifferent roles use diverse dashboards and measurements for the same use case: DS, MLE, business analyst.Different roles get alerts and notifications on different channels but all from the same source of truth.

Time to value

The common approach to traditional software is:  if there’s an off-the-shelf solution that answers your needs, don’t waste time having your developers build one and get into technical debt. After all, building is not just about creating the tool. It involves personnel requirements, maintenance, opportunity cost, and time to value—not to mention quality assurance, patch fixes, platform migrations, and more. Face it, you want your team to be busy using their expertise to advance your company’s core business.  

Required effort

As data scientists and engineers, we love to create technology that solves problems. It’s very tempting to say, ‘hey, let’s do it ourselves, and it’ll have exactly what we want’, especially in a startup environment. If your solution supports diverse scenarios and use cases, you’ll need to customize each one. And that means a lot of extra work. When you use ML for many different use cases, you need a single tool that can handle all the scenarios—present and future—and doesn’t need to be tweaked or customized for each one. Is it really practical to invest hours of your best experts’ time to design and build a solution if one already exists and has been proven in the market? It’s worth seeking out a vendor that has already solved the problem, perfected their solution, and rounded up all the best practices in the area of monitoring.

TCO

A tool that can monitor your machine learning models’ behavior is a system like any other that you develop. It needs to be maintained and upgraded to offer visibility for new features, additional use cases, and fresh technology. As time passes, the TCO of a monitoring tool will begin to grow, requiring more maintenance, additional expertise, and time for troubleshooting. Ask yourself if this will be the best investment of your resources. 

Standardization

Will your monitoring work when there are multiple teams depending on the same tool? Everyone has different needs for how to track, what to track, and how to visualize the data. If you find the right tool ready-made, you’ll be starting off with one single source of truth that meets everyone’s needs. It’s critical to have a dedicated tool that can handle all the monitoring needs of all the teams involved to ensure they are synchronized and work with standardized measurements.  

One source of truth

MLOps is not just about putting the right tools in place. It’s about establishing one common language and standard processes: when to retrain, how to roll out a new version to production, how to define SLA on model issues, and more. To make this happen, you need to first initiate a central method to collect, measure, and monitor all the relevant pieces of information.

Meme showing common ML failure reactions without observability

Just a few short years ago, there simply was no option to buy ready-made tools that could monitor your AI models in production. We didn’t think about whether it was worth the cost of buying them or if it was the right thing to do. We simply went and built it. Happily, today, there are so many amazing things we can take off the shelf, and you should not have to sacrifice the features you need. 

At Superwise, we spent the last two years building a monitoring solution that is adaptable, super-customizable, expandable – and always growing. It can handle what you need for now and the future without you having to invest time and effort to build, troubleshoot, and maintain your own monitoring system.

Ready to get started with Superwise?

Head over to the Superwise platform and get started with easy, customizable, scalable, and secure model observability for free with our community edition.

Prefer a demo?

Request a demo and our team will show what Superwise can do for your ML and business.

Say hello, SaaS model observability 

I’m thrilled to announce that as of today, the Superwise model observability platform has gone fully SaaS. The platform is open for all practitioners regardless of industry and use case and supports any type of deployment to keep your data secure. Everyone gets 3 models for free under our community edition. No limited-time offers, no feature lockouts—real production-ready model observability. 

Head over to the platform now to sign up, integrate your models 

What drives us

Since the day that we started Superwise, we’ve worked closely with our customers to realize our mission of making model observability accessible to anyone. A SaaS platform that will end the need for years-long ML infrastructure and tooling integration projects without compromising an inch on self-service customization and security.

What guides us

There are four core values that resonate throughout the platform and everything we do for our customers.

Make it easy 

Easy to start. Easy to integrate. Easy to see value.

Model observability should be as easy and as obvious a choice as traditional software monitoring. That’s why Superwise is model and platform agnostic, comes with a host of plugins and an SDK, is API-first, and, last but not least, lets you sign up and start on your own. 

Make it customizable 

Custom metrics. Custom monitoring. Custom workflows.

You’re the ones that know your models and business the best. From issues you need to know about, such as bias, drift, and performance. To the workflows you need to build around issues, what domain knowledge and business KPIs need to be incorporated into ML decision-making processes, and how to best alert and empower your teams to resolve issues faster.

Make it secure 

Lightweight, secure, flexible deployments. Data doesn’t leave your organization.

We totally get it. Your data and models are sensitive, and data science and ML engineering teams shouldn’t need to install or manage complex infrastructure to support their observability needs. Whatever your deployment needs, be it pure SaaS or self-hosted, you have control to ensure that no raw data or plain values will ever leave your network. 

Make it scalable

Scalable technology. Scalable automation. Scalable pricing.

You scale, we scale. It’s that simple. Superwise is built for scale and works just as well on 1,000 models as it does on 1. To drive scale, automation is required, from embedded anomaly detection to reduce the tedious efforts of searching for anomalies. All the way up to an open platform approach that enables interaction with Superwise metrics and incidents via APIs. No less importantly, our pricing is flexible and gives you complete control over how and when you scale up or down. 

What’s next?

As awesome of a day today is for us, we’re just getting in gear. Obviously, we’re obsessed with creating a truly streamlined model observability experience that can be customized to any ML use case and that our users love. But for all our roadmap and plans, it’s not about us. How do you use Superwise? What do you love and wish to see? What’s not good enough, and what do you need to close the loop and streamline model observability?

How? Email me at oren.razon@superwise.ai, chat with us in-app, DM us. Whatever works for you, we’re here and would love to chat. 

Understanding ML monitoring debt

This article was originally published on Towards Data Science and is part of an ongoing series exploring the topic of ML monitoring debt, how to identify it, and best practices to manage and mitigate its impact

We’re all familiar with technical debt in software engineering, and at this point, hidden technical debt in ML systems is practically dogma. But what is ML monitoring debt? ML monitoring debt is when model monitoring is overwhelmed by the scale of the ML systems that it’s meant to monitor. Leaving practitioners to literally search for the proverbial needle in a haystack or, worse, hit ‘delete all’ on alerts.

ML monitoring is nowhere near as clear-cut as traditional APM monitoring. Not only are there no absolute truths when it comes to metrics and benchmarks, but models are not subject to economies of scale. It’s easy to spin up a new Kubernetes cluster, and the cluster will be subject to the same performance metrics, benchmarks, thresholds, and KPIs as its predecessors. But when you deploy a new model, even if it’s a pre-existing model and there has been no change to the artifact, it’s practically guaranteed that your references will be different. That means that you’re incurring debt for every model that you deploy to production and monitor.

What is a bad performance level? 80% accuracy? 60% accuracy?

Multiple factors need to be considered to identify a good/bad performance level, and the bottom line will be different depending on each model’s use case, segments, and of course, data. In this post, we’ll explain the debt dimensions of ML model monitoring by using “The four V’s of Big Data” framework, which lends itself surprisingly well for this comparison.

1. Veracity

High dimensionality

Measuring and monitoring a data-driven process dependent on 2–3 elements is reasonably straightforward. But ML is all about utilizing large amounts of data sources and entities to locate underlying, predictable patterns. Depending on the problem and dependent data, you could be looking at dozens of features or even hundreds and thousands of features, each one of which should be monitored independently.

Model metrics

ML is a stochastic data-oriented world combined from multiple different pipelines in production. This means that a host of metrics and elements need to be tracked and monitored for each entity, such as feature mean, std, and missing values for numerical elements and cardinality levels, entropy, and more for categorical elements. Comprehensive model metrics go beyond features, data, and pipeline integrity to provide quantifiable metrics to analyze the relative quality of model inputs and outputs.

Chip Huyen recently published a comprehensive list of model metrics covering the entire model life cycle that’s worth checking out.

2. Volume

Volume in ML monitoring needs to be analyzed on two dimensions: Throughput and granularity

Throughput

Models usually work on large amounts of data to automate a decision process. This poses an engineering challenge to monitor and observe the distribution and behavior of your dataset. A monitoring solution needs to detect data quality and performance issues in minutes in parallel to analyzing huge streams of data over time.

Resolution of data

To detect things on subpopulation levels requires the ability to slice data by segments, but it’s also an analytical challenge. The nature of data and model performance may vary dramatically for the same metric under different subpopulations.

Data Resolution - Population vs. Subpopulation Segmentation

For example, a missing value indicator on a feature called “Age” may usually be 20% on the overall population, but for a specific channel, say Facebook, the value may be optional and, in 60% of cases, is a missing value where for all other subpopulations it’s a missing value in only 0.5% of the cases.

A high-level view will give you only so much information, particularly regarding subpopulations and detailed resolutions critical to support business needs and decisions. Macro events that impact entire datasets or populations are things that everybody knows to look out for and are usually detected relatively quickly.

But this means that the engineering and analytical challenge of detecting issues in a huge stream of data is now multiplied by the number of different segments you need to monitor.

3. Velocity

Models serve the automation of business processes at different velocities, from batch daily weekly prediction and up to real-time ms decisions on a high scale. Depending on your use cases, you’ll need to be able to support varying types of velocities. Still, like with volume, velocity has an additional dimension to contend with, pipeline velocity. Looking at the entire inference flow as a pipeline for continuous improvement. In order to move fast without breaking things, you’ll need to reincorporate delayed feedback into your ML decision-making processes.

In some use cases, such as an Ad-tech real-time bidding algorithm, we will want to monitor for weekly effects as we need to be able to detect data quality or performance issues in a manner of minutes to avoid business catastrophes.

4. Variety

Last but not least, we come to variety. A successful model with business ROI spans more models. Once you get past that first model hurdle and prove ML’s positive impact on business outcomes, both your team and your business will want to replicate this success and scale it. There are three ways to scale models, and they are not mutually exclusive to each other.

Versions

ML is an iterative process, and versions are how we do it. The real world is not static, so pipelines and models must be optimized continuously. Versions are constantly created for the same existing models, but each version is actually a totally different model instance that may have different features or even different baselines.

Use case scale

Adding a use case to your arsenal means you’re essentially restarting the entire MLOps cycle from scratch. You can carry over many things, especially when it comes to feature engineering, but when you deploy to production, you’ll have a new set and scale of model metrics to monitor. In addition to the technical side of ML monitoring, models drive business processes, and each process is different from the others. For the same loan approval model, risk and compliance teams may be concerned about potential biases due to regulatory concerns, business ops want to be the first to know if the model suddenly decides to decline loans across the board, ML engineers need to know about integrity and pipeline issues, and data science teams may be interested in slow drifts in model predictions. The point is that it’s multidisciplinary, and your stakeholders are interested in different aspects of the ML decision-making process. With a new process, you need to make sure that you’re delivering value fast.

Multi-tenancy scale

Multi-tenancy has exponential scale capacity. Deciding to deploy a model across multiple tenets is used when a tenant equals a population in its own right. For example, deploying a learning process that detects potential customer churn, but on each country separately (tenant in this case). The result is a standalone model per country.

Making a decision like this can take you from a single fraud model to hundreds of fraud models overnight. And while they may share the same set of metrics, expected values, and behaviors will vary.

What we’ve learned about model monitoring debt

On the surface of things, model monitoring can seem deceptively straightforward. To be fair, with one or two models, it is feasible to monitor ML manually if you’re willing to invest the resources. But in ML engineering, just like software engineering, everything is a question of the debt and scale. Is it worth taking on and paying down later? Model monitoring is not a simple task, nor is it straightforward both from a technological and process perspective, and as you scale, so does the difficulty of managing ML monitoring.

The 4 V’s illustrate why model monitoring is complex, and as an exercise in quantifying this problem, let’s think about the following numbers:

#models115100
Avg features/model100100100
Avg segments/model101010
Avg metrics/features + outputs + labels555
Data points5,00075,000500,000
Simple ML monitoring noise calc

Now that we’ve quantified the inherent scale problem of ML monitoring and what causes it, the next step is to identify debt. The following parts of this series will deal with identifying debt indicators and best practices to manage and overcome model monitoring debt.

Stay tuned!

Want to see how Superwise can help you stay on top of monitoring debt?

Request a demo to see how!