A new integration just hit the shelf! Sagify users can now integrate with the Superwise model observability platform to automatically monitor models deployed with Sagify data drift, performance degradation, data integrity, model activity, or any other customized monitoring use case.
Why Sagify?
Sagemaker is like a Swiss army knife. You get anything that you could possibly need to train and deploy ML models, but sometimes you just need a knife, and this is where Sagify comes in. Sagify is an open-source CLI tool for Sagmaker that simplifies training and deploying ML models down to two functions, train and predict. This abstracts away a lot of the low-level engineering tasks that come along with Sagemaker.
What you get with Sagify + Superwise
Now that Sagify has simplified Sagemaker training and deployment, the Sagify & Superwise integration streamlines the process of registering your new model and training baseline to Superwise’s model observability platform. This lets you hit the ground running because once you’ve initialized, you get train-deploy-monitor all in one run. Superwise will infer all relevant metrics out-of-the-box (In addition, you can also add customized metrics unique to your use case and business). This way, you don’t need to invest time in configuring model metrics. You can focus on detecting issues like drift, performance degradation, data integrity, etc., to resolve issues and improve your models faster.
If you’re using machine learning and AI as part of your business, you need a tool that will give you visibility into the models that are in production: How is their performance? What data are they getting? Are they behaving as expected? Is there bias? Is there data drift?
Clearly, you can’t do machine learning without a tool to monitor your models. We all know it’s a must-have tool, but until recently, most organizations had to build it themselves. It’s true that companies the size of Uber can build a solution like Michelangelo. But for most companies, building a monitoring platform can quickly transition into something kludgy and complex. In the article understanding ML monitoring debt, we wrote about how monitoring needs have a tendency to scale at warp speed and you’re likely to find that your home-grown limited solution is simply not good enough.
This article will help you with some of the key advantages of using a best-of-breed model observability platform like Superwise versus building it yourself.
Let’s compare
Build
Buy
Time to value
1 – 2 years for MVP.
1 day
Required effort
3 – 5 data scientists and machine learning engineers to build MVP for 2 years.
1 engineer to integrate with Superwise.
Total cost of ownership
30% of DS and MLE time to maintain and adjust a limited solution and react to ongoing business issues through troubleshooting.
Easily expands for new use cases and accommodates maintenance, upgrades, patches, and industry best practices.
Standardization
None. Different DS and MLE teams can use different tools, metrics, or practices to measure drift, performance, and model quality.
Built-in. Multiple teams can work on different ML stacks and use one standard method for measurements and monitoring.
One source of truth
Different roles use diverse dashboards and measurements for the same use case: DS, MLE, business analyst.
Different roles get alerts and notifications on different channels but all from the same source of truth.
Time to value
The common approach to traditional software is: if there’s an off-the-shelf solution that answers your needs, don’t waste time having your developers build one and get into technical debt. After all, building is not just about creating the tool. It involves personnel requirements, maintenance, opportunity cost, and time to value—not to mention quality assurance, patch fixes, platform migrations, and more. Face it, you want your team to be busy using their expertise to advance your company’s core business.
Required effort
As data scientists and engineers, we love to create technology that solves problems. It’s very tempting to say, ‘hey, let’s do it ourselves, and it’ll have exactly what we want’, especially in a startup environment. If your solution supports diverse scenarios and use cases, you’ll need to customize each one. And that means a lot of extra work. When you use ML for many different use cases, you need a single tool that can handle all the scenarios—present and future—and doesn’t need to be tweaked or customized for each one. Is it really practical to invest hours of your best experts’ time to design and build a solution if one already exists and has been proven in the market? It’s worth seeking out a vendor that has already solved the problem, perfected their solution, and rounded up all the best practices in the area of monitoring.
TCO
A tool that can monitor your machine learning models’ behavior is a system like any other that you develop. It needs to be maintained and upgraded to offer visibility for new features, additional use cases, and fresh technology. As time passes, the TCO of a monitoring tool will begin to grow, requiring more maintenance, additional expertise, and time for troubleshooting. Ask yourself if this will be the best investment of your resources.
Standardization
Will your monitoring work when there are multiple teams depending on the same tool? Everyone has different needs for how to track, what to track, and how to visualize the data. If you find the right tool ready-made, you’ll be starting off with one single source of truth that meets everyone’s needs. It’s critical to have a dedicated tool that can handle all the monitoring needs of all the teams involved to ensure they are synchronized and work with standardized measurements.
One source of truth
MLOps is not just about putting the right tools in place. It’s about establishing one common language and standard processes: when to retrain, how to roll out a new version to production, how to define SLA on model issues, and more. To make this happen, you need to first initiate a central method to collect, measure, and monitor all the relevant pieces of information.
Just a few short years ago, there simply was no option to buy ready-made tools that could monitor your AI models in production. We didn’t think about whether it was worth the cost of buying them or if it was the right thing to do. We simply went and built it. Happily, today, there are so many amazing things we can take off the shelf, and you should not have to sacrifice the features you need.
At Superwise, we spent the last two years building a monitoring solution that is adaptable, super-customizable, expandable – and always growing. It can handle what you need for now and the future without you having to invest time and effort to build, troubleshoot, and maintain your own monitoring system.
Ready to get started with Superwise?
Head over to the Superwise platform and get started with easy, customizable, scalable, and secure model observability for free with our community edition.
Prefer a demo?
Request a demo and our team will show what Superwise can do for your ML and business.
I’m thrilled to announce that as of today, the Superwise model observability platform has gone fully SaaS. The platform is open for all practitioners regardless of industry and use case and supports any type of deployment to keep your data secure. Everyone gets 3 models for free under our community edition. No limited-time offers, no feature lockouts—real production-ready model observability.
Head over to the platform now to sign up, integrate your models
What drives us
Since the day that we started Superwise, we’ve worked closely with our customers to realize our mission of making model observability accessible to anyone. A SaaS platform that will end the need for years-long ML infrastructure and tooling integration projects without compromising an inch on self-service customization and security.
What guides us
There are four core values that resonate throughout the platform and everything we do for our customers.
Make it easy
Easy to start. Easy to integrate. Easy to see value.
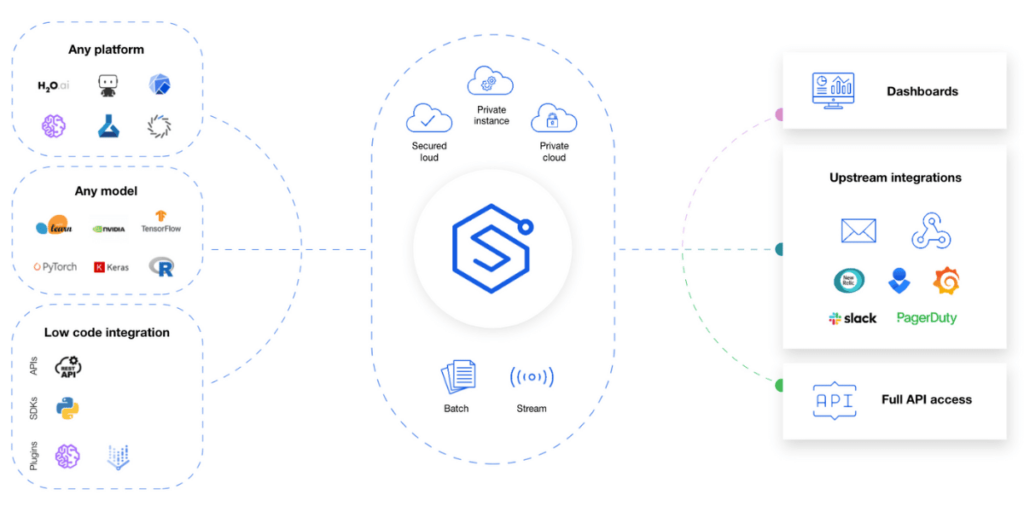
Model observability should be as easy and as obvious a choice as traditional software monitoring. That’s why Superwise is model and platform agnostic, comes with a host of plugins and an SDK, is API-first, and, last but not least, lets you sign up and start on your own.
You’re the ones that know your models and business the best. From issues you need to know about, such as bias, drift, and performance. To the workflows you need to build around issues, what domain knowledge and business KPIs need to be incorporated into ML decision-making processes, and how to best alert and empower your teams to resolve issues faster.
Make it secure
Lightweight, secure, flexible deployments. Data doesn’t leave your organization.
We totally get it. Your data and models are sensitive, and data science and ML engineering teams shouldn’t need to install or manage complex infrastructure to support their observability needs. Whatever your deployment needs, be it pure SaaS or self-hosted, you have control to ensure that no raw data or plain values will ever leave your network.
You scale, we scale. It’s that simple. Superwise is built for scale and works just as well on 1,000 models as it does on 1. To drive scale, automation is required, from embedded anomaly detection to reduce the tedious efforts of searching for anomalies. All the way up to an open platform approach that enables interaction with Superwise metrics and incidents via APIs. No less importantly, our pricing is flexible and gives you complete control over how and when you scale up or down.
What’s next?
As awesome of a day today is for us, we’re just getting in gear. Obviously, we’re obsessed with creating a truly streamlined model observability experience that can be customized to any ML use case and that our users love. But for all our roadmap and plans, it’s not about us. How do you use Superwise? What do you love and wish to see? What’s not good enough, and what do you need to close the loop and streamline model observability?
How? Email me at oren.razon@superwise.ai, chat with us in-app, DM us. Whatever works for you, we’re here and would love to chat.
This article was originally published on Towards Data Science and is part of an ongoing series exploring the topic of ML monitoring debt, how to identify it, and best practices to manage and mitigate its impact
We’re all familiar with technical debt in software engineering, and at this point, hidden technical debt in ML systems is practically dogma. But what is ML monitoring debt? ML monitoring debt is when model monitoring is overwhelmed by the scale of the ML systems that it’s meant to monitor. Leaving practitioners to literally search for the proverbial needle in a haystack or, worse, hit ‘delete all’ on alerts.
ML monitoring is nowhere near as clear-cut as traditional APM monitoring. Not only are there no absolute truths when it comes to metrics and benchmarks, but models are not subject to economies of scale. It’s easy to spin up a new Kubernetes cluster, and the cluster will be subject to the same performance metrics, benchmarks, thresholds, and KPIs as its predecessors. But when you deploy a new model, even if it’s a pre-existing model and there has been no change to the artifact, it’s practically guaranteed that your references will be different. That means that you’re incurring debt for every model that you deploy to production and monitor.
What is a bad performance level? 80% accuracy? 60% accuracy?
Multiple factors need to be considered to identify a good/bad performance level, and the bottom line will be different depending on each model’s use case, segments, and of course, data. In this post, we’ll explain the debt dimensions of ML model monitoring by using “The four V’s of Big Data” framework, which lends itself surprisingly well for this comparison.
1. Veracity
High dimensionality
Measuring and monitoring a data-driven process dependent on 2–3 elements is reasonably straightforward. But ML is all about utilizing large amounts of data sources and entities to locate underlying, predictable patterns. Depending on the problem and dependent data, you could be looking at dozens of features or even hundreds and thousands of features, each one of which should be monitored independently.
Model metrics
ML is a stochastic data-oriented world combined from multiple different pipelines in production. This means that a host of metrics and elements need to be tracked and monitored for each entity, such as feature mean, std, and missing values for numerical elements and cardinality levels, entropy, and more for categorical elements. Comprehensive model metrics go beyond features, data, and pipeline integrity to provide quantifiable metrics to analyze the relative quality of model inputs and outputs.
Volume in ML monitoring needs to be analyzed on two dimensions: Throughput and granularity
Throughput
Models usually work on large amounts of data to automate a decision process. This poses an engineering challenge to monitor and observe the distribution and behavior of your dataset. A monitoring solution needs to detect data quality and performance issues in minutes in parallel to analyzing huge streams of data over time.
Resolution of data
To detect things on subpopulation levels requires the ability to slice data by segments, but it’s also an analytical challenge. The nature of data and model performance may vary dramatically for the same metric under different subpopulations.
For example, a missing value indicator on a feature called “Age” may usually be 20% on the overall population, but for a specific channel, say Facebook, the value may be optional and, in 60% of cases, is a missing value where for all other subpopulations it’s a missing value in only 0.5% of the cases.
A high-level view will give you only so much information, particularly regarding subpopulations and detailed resolutions critical to support business needs and decisions. Macro events that impact entire datasets or populations are things that everybody knows to look out for and are usually detected relatively quickly.
But this means that the engineering and analytical challenge of detecting issues in a huge stream of data is now multiplied by the number of different segments you need to monitor.
3. Velocity
Models serve the automation of business processes at different velocities, from batch daily weekly prediction and up to real-time ms decisions on a high scale. Depending on your use cases, you’ll need to be able to support varying types of velocities. Still, like with volume, velocity has an additional dimension to contend with, pipeline velocity. Looking at the entire inference flow as a pipeline for continuous improvement. In order to move fast without breaking things, you’ll need to reincorporate delayed feedback into your ML decision-making processes.
In some use cases, such as an Ad-tech real-time bidding algorithm, we will want to monitor for weekly effects as we need to be able to detect data quality or performance issues in a manner of minutes to avoid business catastrophes.
4. Variety
Last but not least, we come to variety. A successful model with business ROI spans more models. Once you get past that first model hurdle and prove ML’s positive impact on business outcomes, both your team and your business will want to replicate this success and scale it. There are three ways to scale models, and they are not mutually exclusive to each other.
Versions
ML is an iterative process, and versions are how we do it. The real world is not static, so pipelines and models must be optimized continuously. Versions are constantly created for the same existing models, but each version is actually a totally different model instance that may have different features or even different baselines.
Use case scale
Adding a use case to your arsenal means you’re essentially restarting the entire MLOps cycle from scratch. You can carry over many things, especially when it comes to feature engineering, but when you deploy to production, you’ll have a new set and scale of model metrics to monitor. In addition to the technical side of ML monitoring, models drive business processes, and each process is different from the others. For the same loan approval model, risk and compliance teams may be concerned about potential biases due to regulatory concerns, business ops want to be the first to know if the model suddenly decides to decline loans across the board, ML engineers need to know about integrity and pipeline issues, and data science teams may be interested in slow drifts in model predictions. The point is that it’s multidisciplinary, and your stakeholders are interested in different aspects of the ML decision-making process. With a new process, you need to make sure that you’re delivering value fast.
Multi-tenancy scale
Multi-tenancy has exponential scale capacity. Deciding to deploy a model across multiple tenets is used when a tenant equals a population in its own right. For example, deploying a learning process that detects potential customer churn, but on each country separately (tenant in this case). The result is a standalone model per country.
Making a decision like this can take you from a single fraud model to hundreds of fraud models overnight. And while they may share the same set of metrics, expected values, and behaviors will vary.
What we’ve learned about model monitoring debt
On the surface of things, model monitoring can seem deceptively straightforward. To be fair, with one or two models, it is feasible to monitor ML manually if you’re willing to invest the resources. But in ML engineering, just like software engineering, everything is a question of the debt and scale. Is it worth taking on and paying down later? Model monitoring is not a simple task, nor is it straightforward both from a technological and process perspective, and as you scale, so does the difficulty of managing ML monitoring.
The 4 V’s illustrate why model monitoring is complex, and as an exercise in quantifying this problem, let’s think about the following numbers:
#models
1
15
100
Avg features/model
100
100
100
Avg segments/model
10
10
10
Avg metrics/features + outputs + labels
5
5
5
Data points
5,000
75,000
500,000
Simple ML monitoring noise calc
Now that we’ve quantified the inherent scale problem of ML monitoring and what causes it, the next step is to identify debt. The following parts of this series will deal with identifying debt indicators and best practices to manage and overcome model monitoring debt.
Stay tuned!
Want to see how Superwise can help you stay on top of monitoring debt?
In one day, 2021 will officially be a wrap. Before we all check out for some champagne and fireworks, let’s take a look at a few of our highlights from the last year and how Superwise is enabling customers to observe models at high scale.
Connect anything, anywhere, by yourself
MLOps is a stack. It’s about best-in-breed solutions that streamline your entire model lifecycle and beyond. That’s why we went API-first this year, made integrating with the Superwise model observability fully flexible and model and platform agnostic, launched extensive documentation, and are continuously adding ecosystem integrations like the one we launched with New Relic, and there are many more coming next year.
We didn’t just double down on making Superwise an open platform – we also made any integration a matter of minutes and 100% self-service from the platform UI, Superwise SDK, and our APIs.
Comprehensive metric discovery
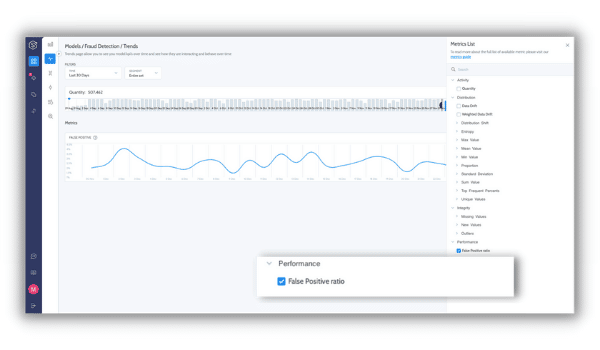
Our metrics were already great, and now they’re even better. All our metrics are automatically discovered and configured whenever you add a model or version. This leverages all of the best practices we’ve baked in to shorten your time to value by delivering out-of-the-box metrics for integrity, activity, distribution, and drift tailored to your models and data. We’ve also just released custom performance metrics, so you can express any business KPI you need to analyze and monitor.
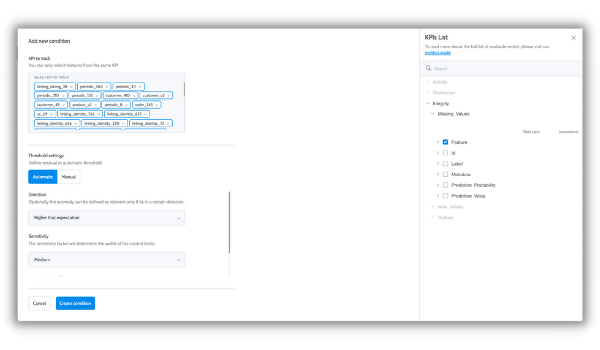
Self-service monitoring policy builder
No one wants to configure policies metric by metric. It’s slow, tedious, and not scalable, given how each model is unique, and monitoring use cases vary. That’s why we rolled out Superwise’s monitoring policy builder:
It lets you build and deploy policies within minutes
Has flexible logic to support any unique use case
Automatically configures thresholds
Lets you control sensitivity based on business impact.
Now you can logically express what events you need to be alerted about, and Superwise will continuously scan your models for you and ensure that the right team gets the right alert at the right time.
Enterprise-grade management
We tripled our user base over the last 2 quarters alone. With more data science and ML engineering teams using the platform to observe their models in production, we added a host of authentication, security, and user management capabilities to the platform.
User management, Multi-Factor Authentication, SAML, token management, and audit logs are all available for our customers on the platform.
2021 has been a year marked with achievements across the board and not just in terms of customers onboarded, feature releases, and engineering accomplishments. We opened our first U.S. office in New York, doubled the team (and still are – check out our open positions here), and even had our first all-hands event since coming back from working remotely!
We’re proud of everything that our team across the globe has achieved over the last year, and given that we know what’s coming up next, 2022 is going to take model observability to a whole new level.
Model observability has been all the rage in 2021, and with good reason. Applied machine learning is crossing the technology chasm, and for more and more companies, ML is becoming a core technology driving daily business decisions. Now that ML is front and center, in production, and business-critical, the need for model monitoring and observability is both plain and pressing. Practitioners across the board agree that ML is so fundamentally different from traditional code that models need a new breed of monitoring and observability solutions. All of this is true, but model observability can be so much more than the sum of its parts when adopted together with a production-first mindset.
This article will explore what a modern model monitoring and observability solution should look like and how a production-first mindset can help your team proactively exploit opportunities that model observability presents.
A new breed of observability
Before we dive into monitoring vs. observability, let’s take a second to talk about what it is about ML that requires a different approach. Ville Tuulos and Hugo Bowne-Anderson recently published a great article on why data makes MLOps so different from DevOps. Simply put, models aren’t linear; they are infinitely more immense, more complex, more volatile, and more individualistic than their traditional software counterparts. They operate at scale, both in terms of input complexity and input volume, and are exposed to constantly changing real-world data. So how do we effectively monitor and observe a system that we cannot model ourselves? Applications with no overarching truths like CPUs where even the ground truths (if we know them at all) are subject to change? Processes where a ‘good’ result can be relative, temporal, or even irrelevant?
This is the true challenge of model observability. It’s not about visualizing drifts and or building dashboards. That just results in data scientists and ML engineers babysitting their monitoring and literally looking for needles in the haystack. Model observability is about building a bigger picture context, so you can express what you want to know without defining minute details of each and every question and model.
The road to autonomous model observability
Model observability is paramount to the success of ML in production and our ability to scale ML operations. Still, just like ML, it is both a high-scale solution and a problem. The first step we need to take to achieve observability is to open the black box and get granular visibility into model behaviors. The ability to see everything down to the last detail is valuable, but it’s not practical at scale. At scale, you don’t have the capacity to look at everything all the time. It’s about automatically showing you what’s important, when it matters, why it’s an issue, what should be done, and who needs to do it.
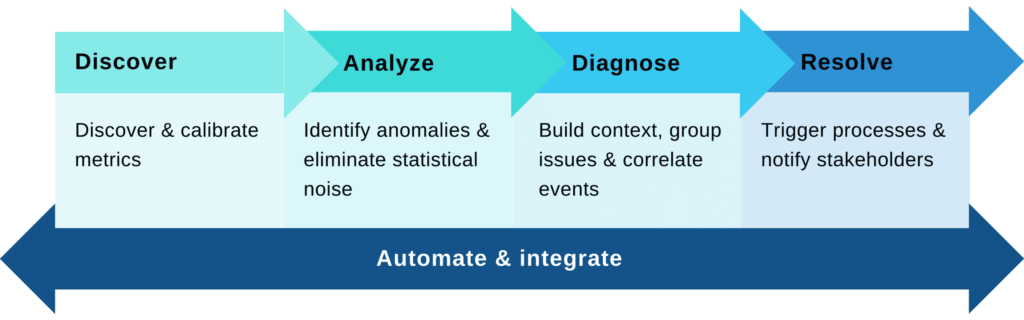
Autonomous model observability must do a specific set of things to justify its claim to fame.
Step 1 is about creating visibility into the black box and discovering the set of metrics pertinent to a model and calibrating their scale. This visibility reflects all the different elements in the process, such as:
Inputs and pipeline health: tracking the drift levels of our inputs to ensure the model is still relevant and validating the health and quality of the incoming data.
Model decision-making stability: how robust is our ML decision-making process? For example, a model now rejects 40% of loan requests relative to the 20% it usually rejects. Is a specific feature now abnormally affecting the decision-making process?
Process quality: measuring the performance of the process, usually in supervised cases, based on the collected ground truth. Such performance metrics can be as simple as precision/recall or complex and even customized to cases. For example, normalized F1 score based on the level of the transaction amount or identifying weak spots that the model is not well optimized for.
Operational aspects: are there traffic variations? Are there changes in the population mix/composition? Is our label collection process stable?
All of the above should be accessible and visible across versions and on the segment level, as many cases occur for a specific sub-population and won’t be apparent on an aggregated view.
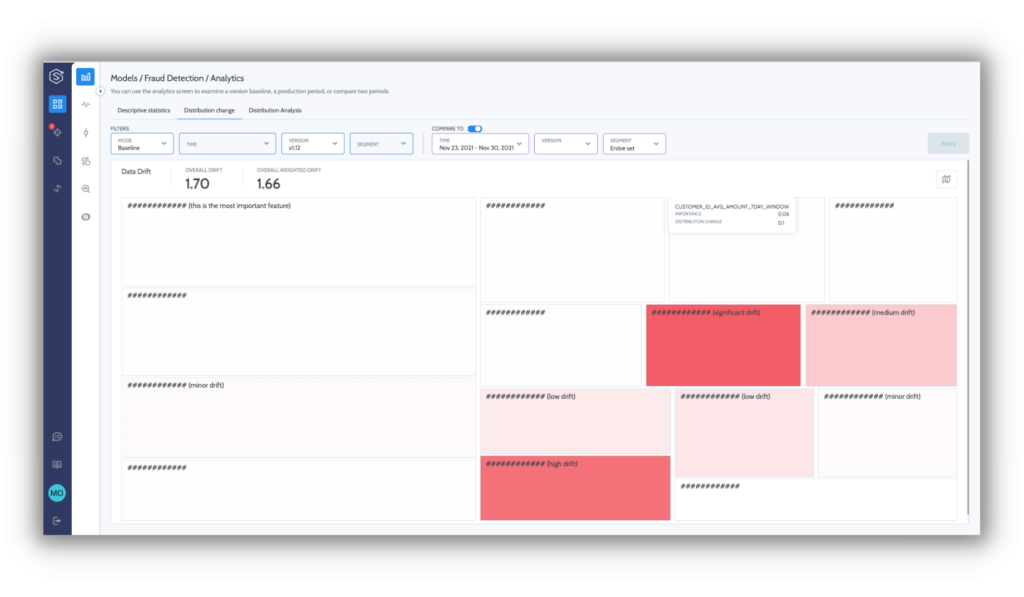
Feature distribution change
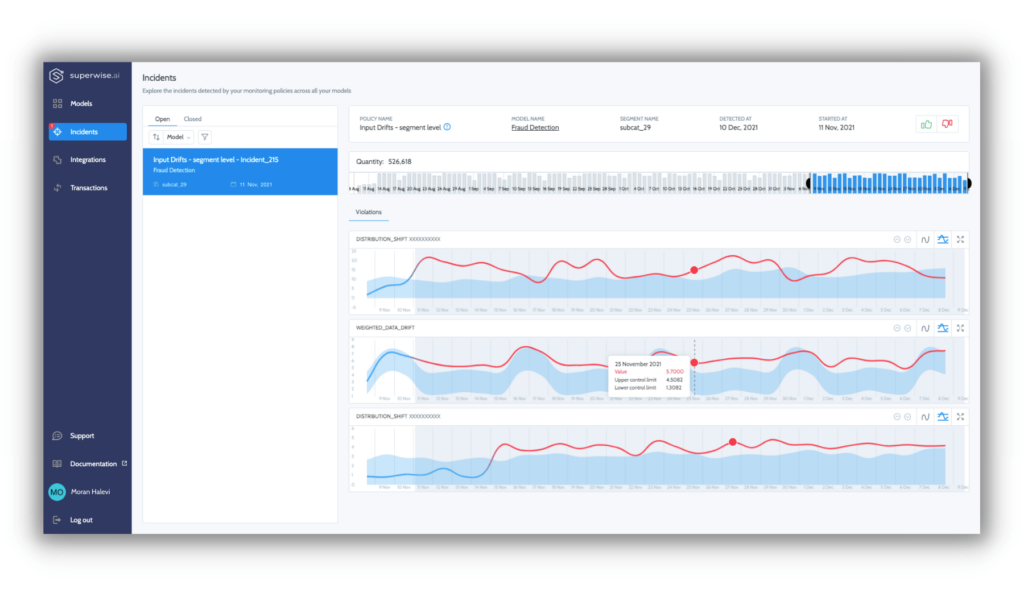
Step 2 is all about zeroing in on signals and eliminating noise by adapting to seasonality and subpopulation behaviors to surface abnormal behaviors. As domain experts, you are the ones that know what types of abnormalities are interesting (e.g., model shift on the subpopulation level), but it’s impossible to manually express them with single, static thresholds that take into consideration the seasonality and temporality of the process.
Step 3 is about identifying risks and streamlining troubleshooting with grouped issues and correlated events to build context for faster root-cause analysis. Correlation isn’t causation, but it’s an excellent place to start analyzing and troubleshooting issues. For example, let’s take an ML process based on multiple data sources exhibiting a pipe issue with a single source. In this case, we’ll probably see an issue/shift in all the features that were engineered based on this source. As that is correlated, it should be displayed together as there’s a strong indication that the underlying data is the root cause.
Superwise incidents
A positive side effect of the context built by grouping correlated events is that it further reduces noise.
Step 4 (the monitoring part) is about taking action and letting you abstractly express business, data, and engineering failure scenarios and how stakeholders should be notified. ML is multidisciplinary, and for different issues, different teams, singularly or in collaboration, will own the resolution. With that in mind, not only is it critical that teams get alerts promptly with all of the in-context information they will need to take corrective action before issues impact business operations, but it’s also critical that the right teams get the right alerts; otherwise, your stakeholders will suffer from alert fatigue. Automating this process is vital to successfully embed the monitoring aspect of model observability within the existing processes of each team.
In addition to all this, autonomous also means giving organizations the freedom to consume observability as they see fit. This goes beyond the self-governing aspects of model observability that discovers metrics and builds contexts. It is about enabling open platform accessibility that lets businesses holistically internalize model observability within their processes, existing serving platforms, and tools. With an open platform, it’s easy to connect and consume each step via APIs. That empowers the organization, builds ML trust, and enables higher-level customizations specific to each organization.
Production-first model observability
Model observability has the potential to be much more than a reactive measure to detect and resolve issues when models misbehave, and it’s the shift to a production-first mindset that holds the key to achieving these benefits. With production-first model observability, every decision to improve a model is supported by production evidence and data. It helps us validate that a model is creating ROI for the organization and ensure that everything we do, be it deploying a new version or adding features, increases ROI and the quality of our business. Production-first model observability completely disrupts the research lead mindset that had dictated data science and machine learning engineering for so long and opens the door to continuous model improvement.
Retraining is only the first and most obvious of continuous improvements. Many other continuous model improvement opportunities can be leveraged, such as A/B testing, shadow releases, multi-tenancy, hyperparameter tuning, and the list goes on. Production-first empowers us to answer our operational ML questions with our data instead of general rules of thumb and best practices.
What subpopulations is our model not optimized for? Or protect subpopulations that are prone to bias?
How do we improve our existing model? Should we add features/ data sources? Should we adopt a different algorithmic approach? Should we eliminate non-attributing features and reduce model complexity?
Production-first model observability exposes continuous improvement opportunities, which means shorter paths to production, robust deployments, faster time to value, and the ability to increase scale.
Want to see what autonomous model observability looks like?